How to analyze paying users, why with increasing audience growth, the share of paying users may fall, as well as how to increase their number, – Vera Karpova, analyst at devtodev, told.
The most favorite metric of all developers is income. Everyone likes to watch the graph of this metric grow up, and take urgent measures in case it falls.
Where does the income come from and why does his schedule jump up and down?
All this happens thanks to the users of the application, and not all, but those who pay. This article is dedicated just to them – paying users (paying users).
Paying users is a quantitative metric equal to the number of paying users for a certain period.
The more such users in the product, the better. And, as a rule, the user metrics of those who pay are higher than the indicators of those who do not pay. For example, the retention of those paying often significantly exceeds the retention of non-paying ones (sometimes several times), and they stay in the project much longer. This is logical: after paying, users show their loyalty to the product, their motivation to return is stronger – they need to use what they were paid for.
Traditionally, when analyzing paying users, they are divided into 3 groups depending on the size of payments:
- whales – users who pay large sums;
- dolphins – those who pay average amounts;
- minnows are users who make payments for small amounts.
Usually there are the least whales in the project, but their share in revenue often prevails over other segments, but minnows make up a large share of the paying audience, and their income is often so insignificant that if they were not in the project at all, it would not even affect the total revenue.
The users in the product are quite different, and each of the segments prefers a certain price range. To get representatives of all segments, it is necessary that there are corresponding products for each group in it. For example, to have whales in the product, you can create exclusive content for them that would be useful and interesting to them, and at the same time allow them to spend a good amount of money.
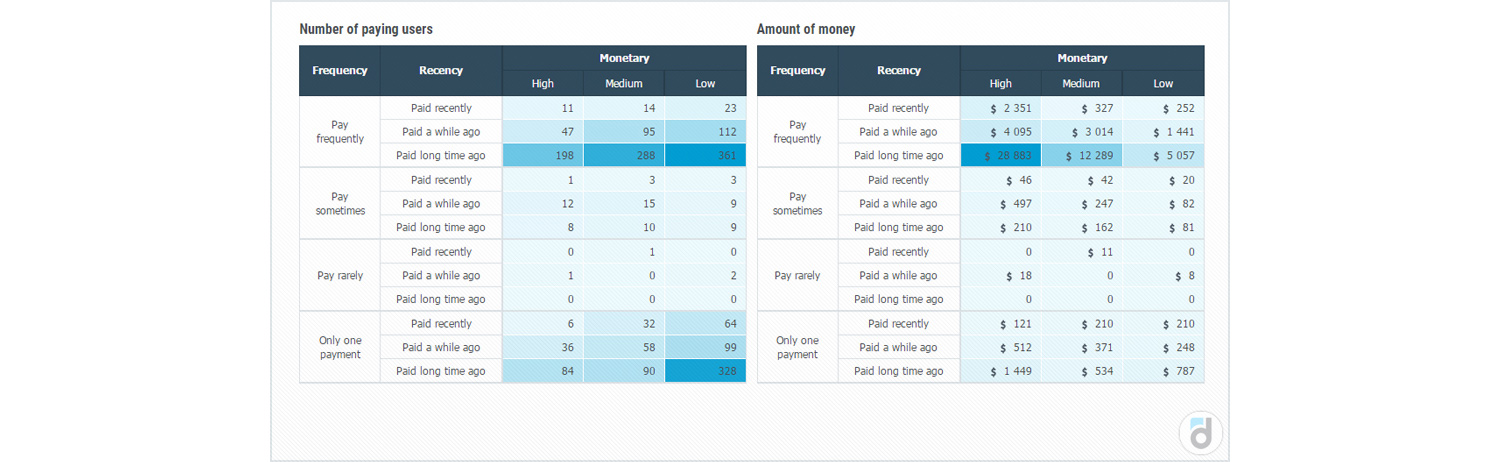
Another way to analyze the paying audience is RFM analysis, which shows the distribution of users by prescription (R – recency), frequency (F – frequency) and size (M – monetary) of their payments. This analysis allows you to identify certain user segments and, by counting the number of users in each segment, assess which segment prevails in the project and what is the biggest problem.
To distinguish these segments, you need to assign each user a “score” for each of the 3 criteria, using quartiles or your own expert assessment of the amount of the total payment, starting from which the user refers to dolphins or whales.
Then you can form them into groups. Here are some examples:
- Those users who have the highest scores in all 3 parameters (paid recently, often and a lot) are the most loyal and profitable. Take care of them!
- Those who paid a lot and often, but have been loyal for a long time, are on the verge of leaving, since their purchasing activity has decreased recently.
- Those who have made payments for a long time and rarely, probably, were not interested in the product from the very beginning, it is unlikely that they will be able to return them.
Depending on the segment, the marketing activity aimed at this group of users will also differ. For example, those who got into the outgoing segment, you can try to return to the project by sending a targeted push notification; to those who once often paid good amounts, offer a bonus or discount to regain their interest; loyal – to protect and maintain their activity in the product; and those who have only done one payment, the incentive to make a second, third and so on.
Another important indicator that should be allocated additionally from the total number of paying users is the users who made their first payment (new paying users), since after the first payment, repeated payments usually occur, which often bring most of the income. Therefore, as we said earlier, you need to carefully monitor that the first payments are converted into subsequent ones.
You can increase the number of paying users in the following ways:
- add new interesting content for users;
- experiment with the prices of existing products;
- offer users a discount on any of the products.
But there is one more open question: how to assess the dynamics of changes in the paying audience?
The paying audience is an absolute value, its growth or decline depends on various factors. An increase in the number of paying users does not always lead to an increase in income (for example, their number began to grow, but the amount of payments decreased). How can we understand that their growth is not the result of our actions, but a consequence of the overall growth of the audience?
As for income and other quantitative indicators, there is a relative metric that shows what percentage of users from the entire active audience make payments in the product. For paying users, this is a share of the entire audience (Paying share or Paying users rate).
It is calculated by the formula:
Share of paying users = Paying users / Active users
This value depends on the type of application, but it is often quite small – about 1-2%.
It is believed that the median indicator of paying users in mobile f2p games is 1%. That is, the vast majority of the audience usually prefers not to pay.
I would like to note that these are more auxiliary than independent metrics. When analyzing them, it is worth paying attention to related indicators, such as ARPPU, for example, because the number of payers may grow, while income will fall (if the average payer’s check falls).
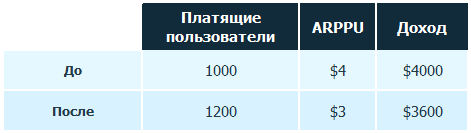
Income = ARPPU * Paying users
Or the share of those paying will fall, but due to the growth of the average check, this will have a positive effect on income.
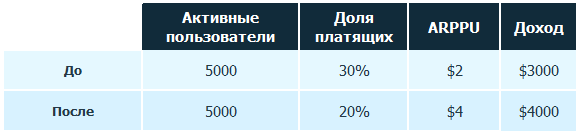
Revenue = Active Users * Share of paying users * ARPPU
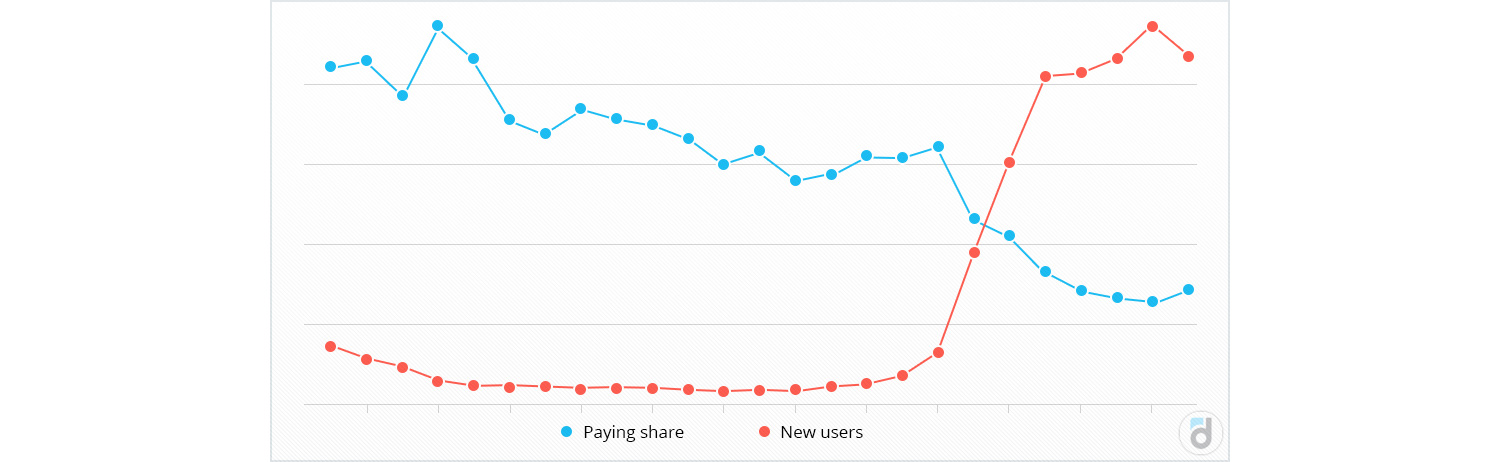
Comparing the dynamics of changes in the number of paying users and the share of paying users is better relative to other indicators.
For example, if the active audience is growing or the number of new users is growing, and the share of paying users is falling, this may indicate inappropriate traffic.
Paying users are the most valuable in the project, but they also behave differently, therefore, so that they continue to contribute to the growth of product revenue and remain loyal to it, it is worth studying them carefully and making their stay in the product and its use as convenient and useful as possible.
See also: