What is ROI, what are the ways to calculate the return on investment, how to track the rate of return and what other indicators exist that help in assessing the commercial success of an investment project, – says Vera Karpova, analyst at devtodev.
This is the seventh publication App2Top.ru and devtodev as part of a series of materials about gaming metrics. Articles are divided by seasons, each of which is dedicated to a specific topic. The first season is called “Money”. In it, we talk about performance indicators related to money.

Vera Karpova
When we make any purchases, we want to get a useful result from them as soon as possible. After buying a car, we comfortably start driving to work, enjoy our favorite game with the new PlayStation, pay a fitness instructor, expect to get a toned body, and after paying for dinner, have fun Friday night with friends.
Similarly, when investing money in a project, an investor wants to benefit from this investment (only in monetary terms), and preferably as soon as possible.
An indicator of how the invested money is returned is the ROI (Return On Investment) metric – return On investment.
There are several ways to calculate this indicator. The first one looks like this:
ROI = (Revenue – Investments ) / Investments
The amount of investments is deducted from the income received from investments and divided by the amount of investments.
In this case, if the ROI is > 0, then we can assume that the investment has paid off.
The second method is a little simpler – the income received from investments is divided by the amount of investments.
ROI = Revenue / Investment * 100%
With this calculation, the ROI ratio > 100% will indicate payback.
An equally important question, after the fact of payback, is its term – after what time the invested funds will return. Therefore, in order to control the process and the rate of return on investment, ROI can be tracked already in the first week and counted on the 7th, 14th, 30th, 60th, 90th and other days.
At the moment when the income received becomes equal to the amount of investments and the ROI is equal to 0 or 100% (depending on the calculation method), they can be considered paid off. And all the subsequent income that the project will bring will only be a plus.
Knowing the ROI values on certain days, you can not only track how funds are returned, but also compare the payback of investments in various projects.
Let’s take this as an example.
Let’s say we have 2 projects: $500 was invested in the first, $1000 in the second. Now let’s see how the money spent is returned using the second formula:
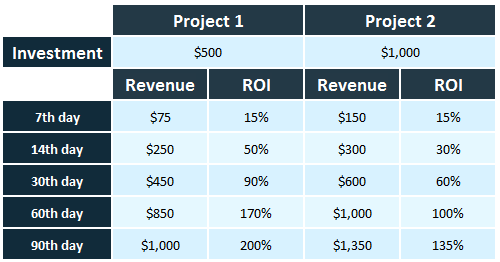
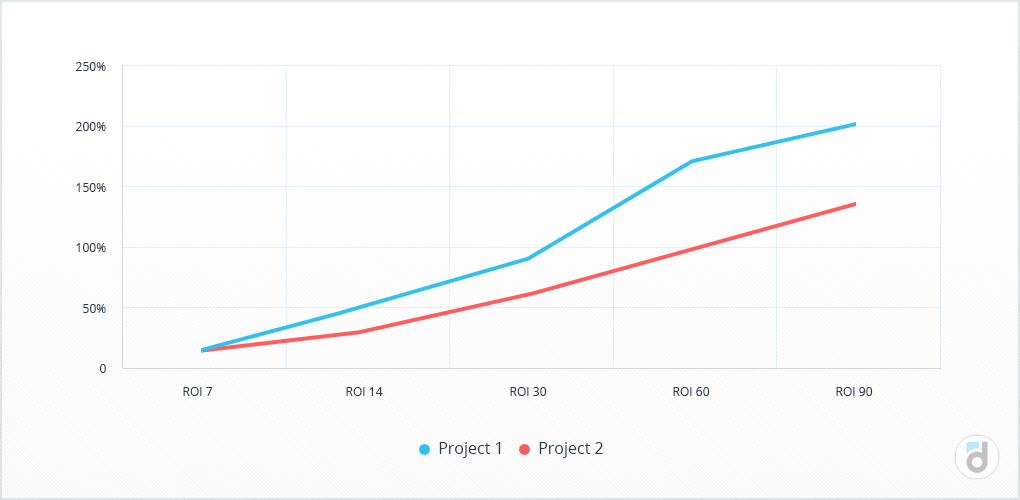
Despite the fact that the second project brings in more money, the first one pays off faster.
It is this ROI calculation – on certain days – that allows you to compare different projects, even if the investments were not made at the same time. If we take into account only the final ROI, then it is possible to mistakenly compare its indicator for a project that has “lived” for 30 days with one that has been on the market for six months.
A special case of ROI is such an indicator as ROMI (return on marketing investment) – return on investment invested in marketing. In fact, this is the same indicator that simply emphasizes that ROI can be used in relation to marketing campaigns, on a par with other areas.
A fairly frequent use of ROI in marketing is the analysis of the return on investment in traffic. In this case, the formula can be slightly modified and considered as LTV (Lifetime value) minus CPI (cost per install) divided by CPI, that is, the income that the user brings for his entire “life” in the project, reduced by the cost of attracting this user, is divided by the cost of attracting:
ROI = (LTV – CPI) / CPI
Or the second version of the formula:
ROI = LTV / CPI * 100%
In this case, the ROI can also be calculated on a certain day from the moment the application is installed by the user, only instead of LTV, the cumulative ARPU for the desired day will be used in this calculation.
ROI N day = (Cumulative ARPU N day – CPI) / CPI
or:
ROI N day = Cumulative ARPU N day / CPI * 100%
When analyzing traffic, you should not focus on ROI alone, because in addition to the metrics listed above, you can get even more information about the user – from ARPU to his behavioral characteristics, which will also help to assess how high-quality and targeted traffic is, for example:
- ARPU, conversion to registration or purchase;
- the number of sessions that one user commits;
- Retention, which can be evaluated already in the first days from the moment of installation;
- execution of certain events;
All this will help to understand even better what kind of users come to the project from a certain channel.
A small example in which, unlike the first one, we will take into account several more indicators. Let’s say we have two projects with the following parameters again:
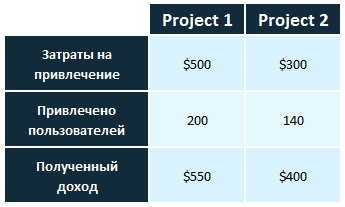
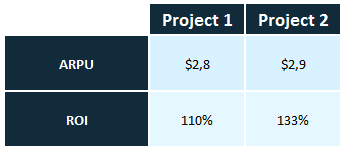
Using this data, it is possible to calculate not only ROI, but also ARPU – an indicator that takes into account paying and non–paying users, and the amount of payments – after which the second project looks even more profitable, since it pays back the investment faster and attracts users who pay more on average.
There are two more indicators that will help assess the success of an investment project – NPV (net present value – net discounted income) and IRR (internal rate of return – internal rate of return). Let’s look at them in a little more detail.
The first indicator (NPV) allows you to take into account discounting when calculating the potential profit from the project.
It is equal to the sum of all receipts multiplied by the discount factor:
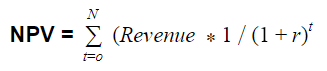
Here r is the discount rate, t is the time intervals whose receipts we sum up.
For successful investments, this indicator will be greater than 0, and the higher it is, the more profitable the project.
Let’s calculate it for 2 projects that were considered in the very first example. Let’s assume that the discount rate is 10%, then for the first month and the first project, the calculation will look like this:
($450*1 / (1+10%)1 = $409 .
Similarly, you can make a calculation for all other periods:
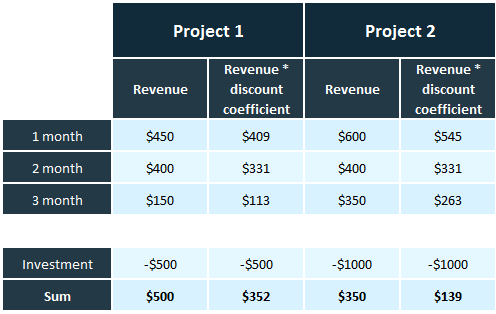
Summing up the NPV with investments in the project, we see that the final indicator of both projects is greater than zero, which means that they will both reimburse the investment, but at the same time the first one looks more attractive, since its NPV is higher than that of the second project.
Now consider the second indicator – IRR. It is quite closely related to NPV, because it is the interest rate at which NPV is zero.
Therefore, all you need to do to calculate the IRR is to equate the previous formula to zero and calculate the interest rate.
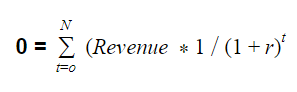
Here r is the desired IRR.
The IRR shows at what interest rate the invested investments will be fully repaid.
In our example, for the first project it will be 54%, and for the second 19%, which also indicates the advantage of the first project.
I always want to get the opposite result by investing my money, and even better, when it can be measured. For financial investments, we have considered the main indicator. It is good because it simultaneously takes into account both the funds spent and the income received, thereby determining the expediency of the investments made. Its use will allow you to control the invested funds and manage them more efficiently.
See also: