How to find the best formula for the retention forecast in his game, – App2Top.ru Vasily Sabirov, a leading analyst at devtodev, told.
Whatever your product is (online or offline, for the web or mobile, a game or a service), user retention rates will play a crucial role in it.
Retention is a metric of product quality that reflects the loyalty of users to you, their desire to stay with you after a while.
By retention indicator we mean the classic “retention” of the nth day – the proportion of users who use the product even N days after their first visit.
Let’s say that on April 1, 100 users launched your game for the first time. Of them, someone did not even launch the tutorial, someone started training and did not finish it, and someone passed it completely.
And on April 2, out of these 100 users, let’s say 40 returned to you. Thus, we say that the retention of the first day is 40% (by the way, it’s quite good, for successful games, just a value of 40% is a guideline).
And on April 8, out of these 100 users, only 15 came to you. This means that the retention of the seventh day = 15%.
The graph of the user retention indicator has a similar appearance for web applications, mobile applications, online stores, and many offline products:
- in the first days (weeks, months), it drops sharply: users do not have time to go through “onboarding” (here – adaptation, – approx.editors) and do not remain in the project;
- then those who still remain gradually fall away, but not at the same speed as at the very beginning;
- finally, when the user base is already formed, the graph goes to a plateau, which is only barely decreasing, and the more time has passed, the more the graph looks like a horizontal line.
Graphically, the retention schedule looks something like this:

Such a curve is also called “forgetting curve”, because it also describes the process of forgetting the information received by a person.
Sometimes the following situation may arise: you have retention values for some fixed periods (1 day, 7 days, 30 days), and you want to know the indicator values for intermediate periods (6 days, 14 days, 23 days) or after them (35 days). This can be useful if you want to predict the “lifetime” or LTV (Lifetime Value), as well as simply calculate how many of the currently active users will be active in the future.
What to do if there are such tasks?
In this article, we just want to share our experience of solving this problem.
In this case, you will have to model this hyperbole yourself and answer the questions you are interested in according to the model value.
Do you remember when you were at school building curves by points? That’s exactly where this knowledge will be useful to you. The only thing is to be prepared for the fact that in the end the equations will be a little more complicated than at school.
To begin with, we will prepare the programs that will be used for this. By the way, we have specially chosen free and publicly available tools to solve the problem, so that you can later do the same yourself “without SMS and registration”:
- Open Office, namely its spreadsheets and the Solver in the Service tab;
- A “nonlinear solver” that needs to be installed as a separate free plugin.
We will also use the approximation mechanism, that is, the approximation of the actual values by mathematical formulas. When making an approximation, it is important, firstly, to choose the right function (which would bend in the right places) and, secondly, to choose its coefficients correctly so that the difference between the model and the fact is minimal.
So, which of the functions can be approximated by retention?
Hyperbole comes to mind (for those who completed a school math course), and this is a true association.

Consider several hyperbolic equations (X in the equation means the number of the period: day, week, or month). Let’s start with a simple hyperbola equation A/X, then we will complicate it by adding various coefficients:
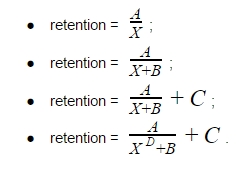
The unknowns A, B, C, D are the coefficients that we have to find.
But our task is not only that. Having found the values of the coefficients in each of the formulas, we will then have to choose the most optimal of these equations.
That is, the result of each of the equations is a separate curve. We will compare this curve with the actual values (which, I must say, do not always fit perfectly into the model) and choose the one of the curves that best repeats the fact.
The criterion will be the minimum of the sum of the squares of deviations (which means that we used the least squares method) between the actual and model values (the least squares method is already beyond the school curriculum, we are talking about the evaluation theory section in mathematical statistics – this is already taught in higher educational institutions, – approx. editorial offices).
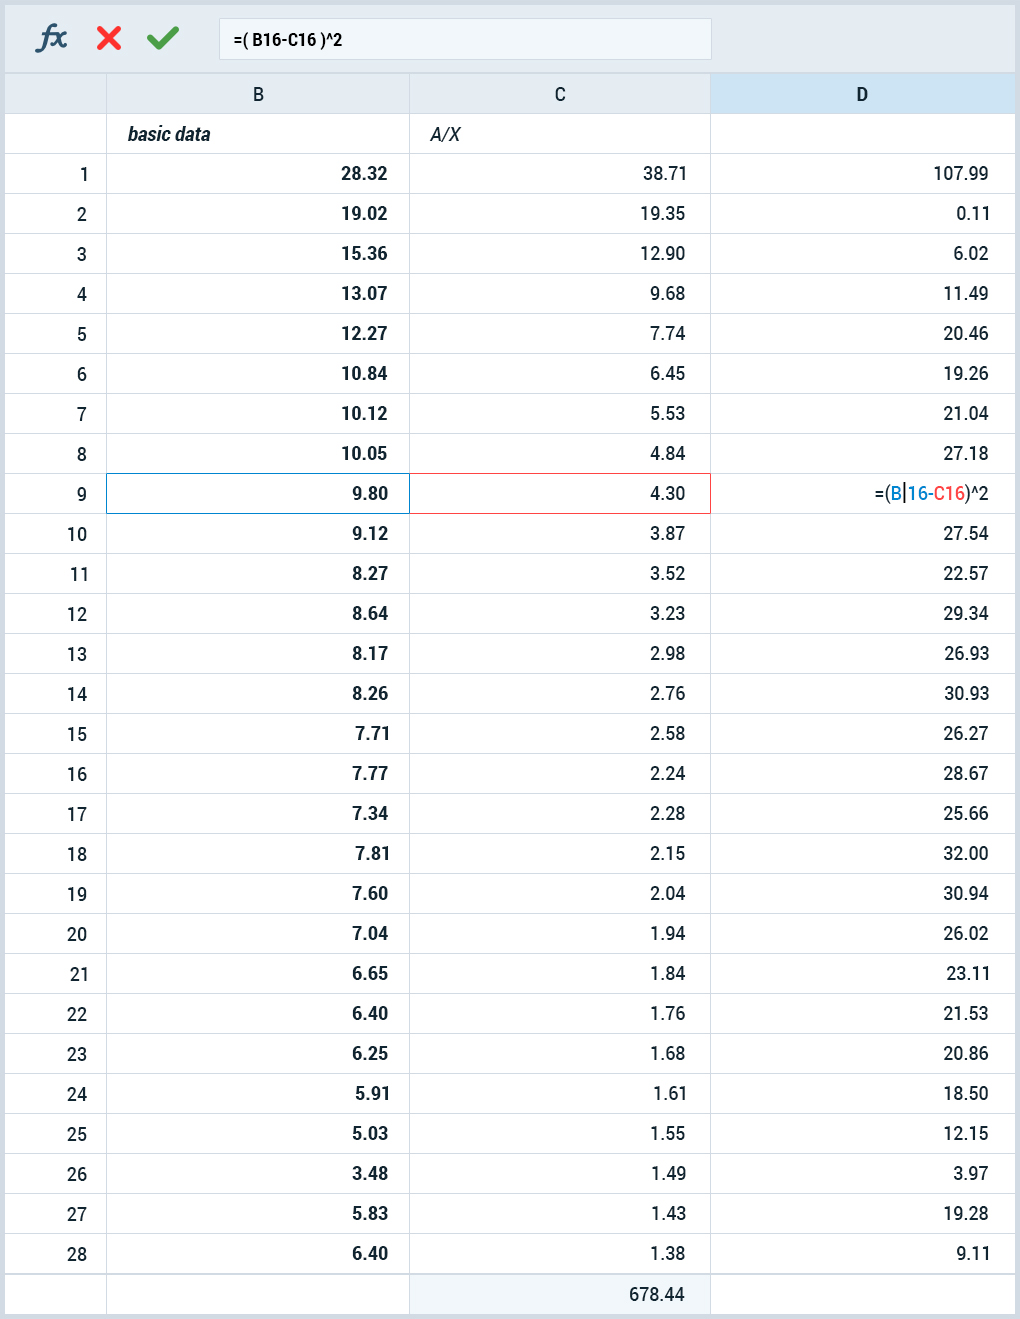
In Excel, this is done using SUMXMY2, and in Open Office we have not detected this function, but this is not a problem: we calculate deviations in a separate column (just as the difference between model and actual values), square them, then sum up the squares of deviations.
Solver will be useful for optimization. Moreover, taking into account both the squares of deviations and the hyperbolic form of the function, it is the nonlinear one that is needed.
Here and further, we used the DEPS Evolutionary Algorithm and SCO Evolutionary Algorithm alternately, and the values of the coefficients obtained in the previous iteration were taken as the starting data of the new iteration. The process ended when the sum of squared deviations with a new iteration decreased by no more than 0.01.
For the initial data, we will take the retention of the devtodev demo project (you can repeat the same thing yourself, the demo is available without registration) for 28 days.
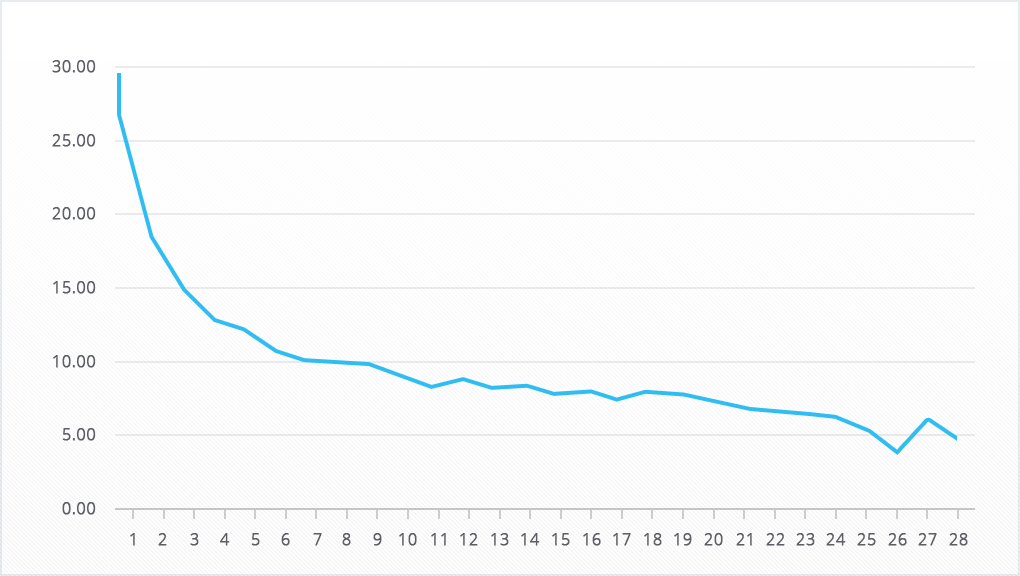
As you can see from the graph, the data is far from perfect, and this is great for our task. Rarely in practice do you get perfect data in your hands, and you still need to solve the problem.
We will try to select such coefficient values for each of the selected functions in order to construct a curve as close as possible to the original data.
Here’s what happens:
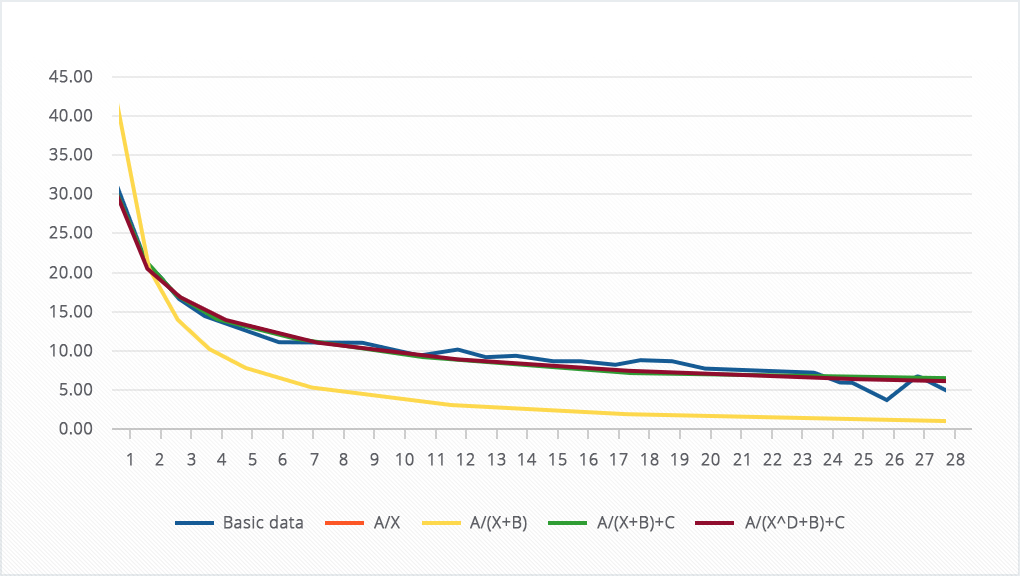
As you can see, the yellow (A/(X+B)) and red (A/X) lines coincided, but they are very far from the original curve, but the green (A/(X+B)+C) and maroon ((A/(X↑D+B)+C) the lines fairly accurately repeated the original curve. At the same time, the maroon line, judging by the sum of the squares of deviations, repeats the starting data most accurately:
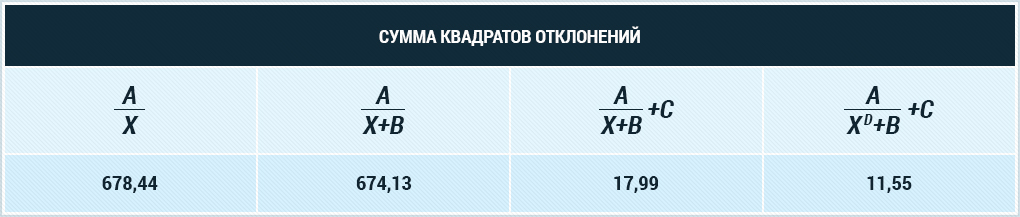
Thus, we say goodbye to the equations A/(X+B) and A/X and move on.
If you pay attention to the curve, you can see that it changes less and less every day. This reminded us of the logarithmic curve, and we thought: what if instead of X we substitute LN(X) into the equation, wouldn’t this improve our results?
So next step, let’s compare the results of the best function with X and LN(X). The only thing is that in one of the cases we will add the coefficient E under the logarithm:
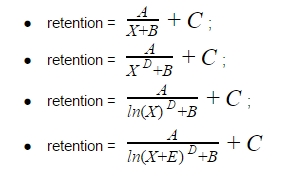
Visually, all four curves coped quite well, but let’s still consider the squares of deviations:
What conclusions can be drawn?
- curves with four and five variables are best approximated;
- replacing X with LN(X), albeit a little, but improves the approximation.
At this stage, we say goodbye to the curve A/(X+B)+C. She couldn’t stand the competition.
There are three curves left, but it is not known how they work over long distances. We tested them only on the first 28 days. It is quite likely that if you substitute a large value instead of X (say, 365), then they will go into negative, which is impossible by definition of retention.
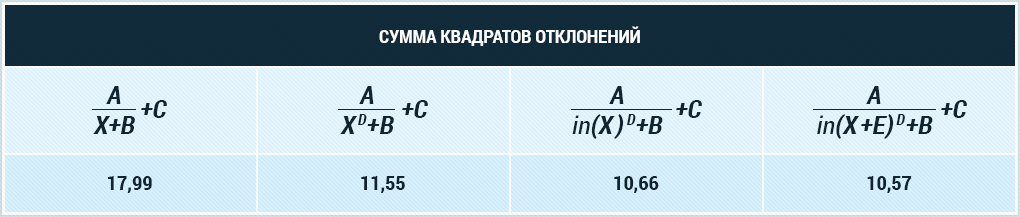
Therefore, since we have identified three finalists, let’s test how they can cope with longer-term retention in the next stage. We just took a few examples of long-term retention from the internet and tested our curves on each of them:
- in 12 weeks;
- for 18 months (carefully, LinkedIn, you will need to install a VPN extension on the browser to view it, – approx. editorial offices);
- in 720 days.
Let’s consider an example about 720 days graphically.
The data was taken from the article “How to measure the success of your app”, and in this case we tried to repeat the above statistics on retention in the social network:
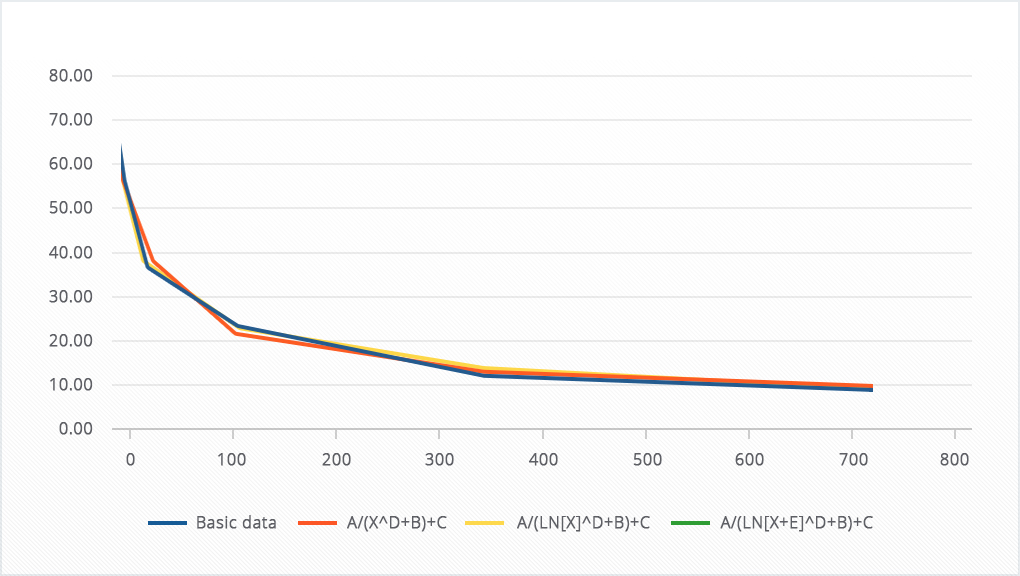
It can be seen that all three curves coped well with the approximation, but the red line is slightly stronger against the blue background – it has the maximum deviation.
Now we share the results for all three examples (recall that the smaller the sum of the squares of the deviations, the better):
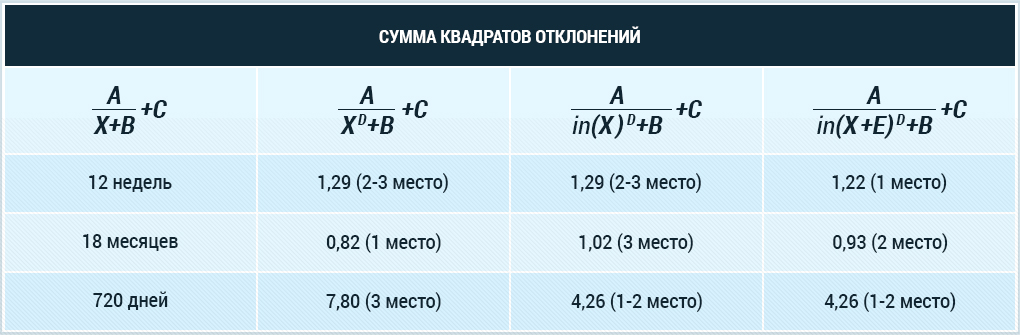
If it was a championship, the last curve would have won. However, you must agree that its advantage is not so obvious, especially considering how the values of the sum of the squares of deviations do not differ much from each other. Therefore, the winners (as at a children’s party) we recognize all three curves, and we can recommend all three curves to approximate retention.
I would also like to tell you about the value of each of the coefficients using the example of the function A/(ln(X)↑D+B)+C.

The conclusion we come to is the following: three types of curves are well suited for the approximation of retention:

We have announced the winners, now we want to announce a few important points to keep in mind when approximating retention.
1). If you have few starting points, it is better to use the curve with fewer coefficients. And remember: never use a curve that has more unknown coefficients than you have points! For example, if you have only three retention points (for example, day 1, day 7, day 28), then the maximum number of coefficients that you can use is three, and in this case the function A/(X+B)+C is best suited.
2). You are always free to change the optimization function as you please (we used the standard OLS and used a simple sum of squares of deviations). Let’s say that the retention behavior is not so important to you in other periods, but you want the model and actual retention values to exactly coincide for 180 days. Therefore, for the optimization function, the deviation of 180 days can be taken with a large coefficient or to a large extent.
3). We are not giving you a universal recommendation, but simply our experience in solving several one-time tasks. It is possible that there are other functions that more accurately approximate retention rates. But the functions that we used gave a good result.
You can download the file with all the calculations from the link.
At the end of the article, we would like to wish that the retention rate in your project always remained unpredictably high.