Vera Karpova, analyst at devtodev, told how to calculate ARPU correctly, where knowledge of this metric can be useful, as well as how to increase it.
By this publication App2Top.ru and devtodev begin a cycle of materials about game metrics. The articles will be divided by season, each of which will be dedicated to a specific topic. The first season is called “Money”. In it, we will talk about performance indicators related to money.
How to count ARPU
One of the most popular and most important monetization indicators is ARPU. It is used to compare the effectiveness of projects and it is this metric that partners and investors are usually interested in.
ARPU (Average Revenue Per User) is the income that one active user brings on average over a certain period of time.
To calculate ARPU, you need to divide the income for the selected period by the active audience.
ARPU = Revenue / Active usersFor example, with an audience of 5,000 users, the revenue of the application is $3,000, which means that on average one user brings $0.6 to the project.
ARPU = $3000 / 5000 = $0,6
You can also often find such a metric as ARPDAU. This is the same ARPU, only calculated for one day, i.e. the income of one day is divided by the number of active users on that day (DAU).
Similarly, you can calculate ARPMAU (Average revenue per monthly active user) – dividing the monthly income by the MAU of the product.
ARPU is one of the key indicators of the monetization efficiency of the project and directly affects revenue, since the formula for calculating it can be represented as follows:
Revenue = ARPU * Active users
Accordingly, the higher the ARPU, the greater the revenue of the application will be.
It also follows that ARPU is a very convenient metric for evaluating changes made in the project and various experiments, since it takes into account both paying and non–paying users and contains 2 additional parameters at once, which greatly simplifies the analysis.
ARPU = ARPPU * Paying Share
Here ARPPU – Average revenue per paying user is the average income from one paying user, and Paying Share is the share of paying users from the entire audience.
Let’s say 1000 users came to the application during the selected period, 100 of them made a payment totaling $ 500.
It turns out that the average user brings in $0.5.
ARPU = $500 / 1000 = $0,5
Out of the entire audience, 100 users bought something
Paying share = 1000 / 100 = 10%
And the average payer’s check is $5
ARPPU = $500 / 100 = $5
Combining Paying share and ARPPU, we get:
ARPU = 10% * $5 = $0.5
Where ARPU can be usefulTo analyze price experiments
Let’s say the product cost $15 and generated revenue of $1,500 with an audience of 1,500 users. And then we raised the price to $17. As a result, not only did a little less users come – 1200, but the income also fell to $ 1400. How do I know if it was an effective price increase? Is the drop in income related to it? To answer these questions, we will calculate the ARPU:
ARPU up to = $1500 / 1500 = $1.00
ARPU after = $1400 / 1200 = $1.17
Not such an unsuccessful experiment as it seemed. Because if you increase the number of users to the previous level at the new price, then the income will grow:
$1.17 * 1500 = $1755, against $1500, which was before the price increase.
For traffic analysis
Let’s assume that our product costs $2. A monthly audience of 1,000 users generates revenue of $400.
ARPU = $400 / 1000 = $0,4
Then we added traffic, there were more people – 1500 and the income grew to $500. It seems to be good, but if you count the ARPU, it turns out that it has decreased
ARPU = $500 / 1500 = $0,3
It turns out that the average user now brings less income than before. Probably, the traffic was not quite targeted.
In the same way, you can compare different traffic channels, and it is important to remember that the more ARPU, the more revenue will be.
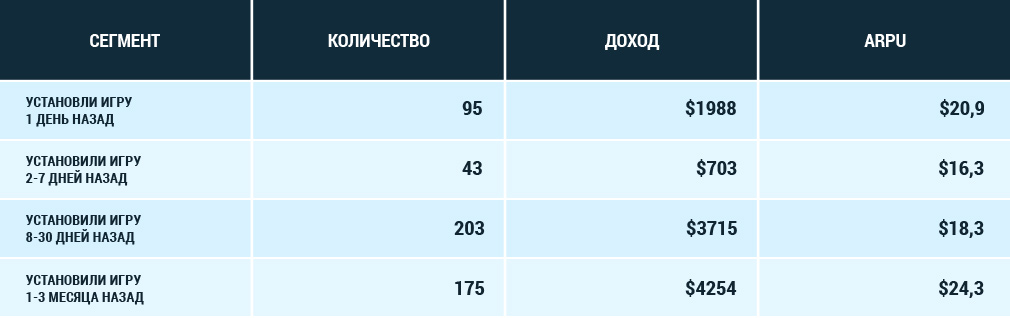
To compare user segments
Let’s say there are several types of players in your product, everyone behaves differently, they pay too, and the number of users in each group is very different. To understand which of these segments is the most loyal and profitable, you can compare them using ARPU:
It can be concluded that the product has a large part of loyal users who have been using it for a long time and on average pay the largest amount for this application.
At the same time, new users, who are much smaller, also bring a good income compared to other segments.
By focusing on these user groups and increasing the number of people in them (especially newcomers), you can significantly increase the overall revenue of the product.
How to boost ARPU
First of all, it is worth paying attention to two metrics that are part of the ARPU formula – these are Paying share and ARPPU.
The more users you can convert into a payment, the more ARPU and, accordingly, income will be.
As for ARPPU, in order to increase it, you can conduct price experiments, or increase the value of the product for the user, as well as pay attention to the conversion into repeated payments, because according to the results of research it turned out that the more payments the user makes, the higher his subsequent payment.
It is also important to understand that a simple increase in the price is likely, although it will lead to the desired increase in ARPPU, but it is far from the fact that the total income will grow with it, because the share of payers may drop significantly and the profit from paying will not compensate for the decrease in their number.
Now you know how to evaluate the success of your product and user loyalty, as well as compare different traffic sources and evaluate experiments. But there are many other interesting and useful metrics that will allow you to look at the project from different angles.
See also: