What is conversion, how to calculate it and how it affects revenue, says Vera Karpova, analyst at devtodev.
Quite often, when discussing a particular project, we use the term “conversion” (conversion). When analyzing a product, a lot of attention is paid to this indicator, and any developer tries to maximize this metric.
Conversion is the percentage of users who have completed a target action. Such an action can be clicking the “Register” button on the landing page, clicking on an advertising link, or, for example, making a payment.
We will consider the latter case in more detail, since it is the most important one for the project. And most often, when they say “conversion”, they mean exactly “conversion to payment” (paying conversion).
Before you output the formula for conversion, I would like to note an important feature of its calculation. It consists in the fact that this indicator is calculated for a cohort, that is, for a group of users who installed the application during a certain period.
So, the conversion to payment is the percentage of users who have made a purchase from those who have installed the application.
Conversion to Payment = Paying Users / New usersConversion has a direct proportional effect on income.
So by increasing this indicator, you increase the number of users who make payments, which leads to an increase in revenue.
Revenue = New Users * Conversion rate * ARPPU
 However, if an increase in conversion occurs due to a decrease in the average user’s receipt (or the price of the product), then the result may be negative.
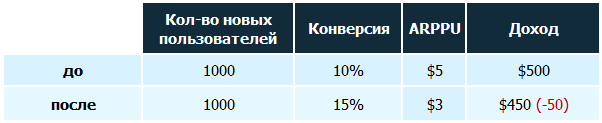
Therefore, experimenting with conversion, it is worth monitoring other financial indicators.
This is quite an important point to pay attention to, especially when conducting promotions in a product, when prices for goods are falling. It is far from always a decrease in prices leads to a decrease in income, but it is still necessary to control it.
In addition to promotions and discounts, conversion can be influenced by: the design of the product and its individual elements, the texts of headlines and marketing offers, the simplicity and clarity of the interface, timely purchases offered, competent CTA elements, the presence of positive reviews about the product and much more.
All this is quite individual for each project, and what multiplies the conversion rate in one product may not affect the conversion rate in another. But it’s still worth experimenting to find something that will work for you.
Conversion analysis can be made even deeper if you use some additional approaches.
Separation of payment types
The conversion should not be considered for all payments, but separately for the first and repeated ones, which will give more understanding about the behavior of users in the product. In this case, the conversion to a repeat payment is the percentage of users who made more than one payment during the analyzed period.
Moreover, repeated payments can be divided into the 2nd, 3rd, nth and calculate the conversion for each separately.
It is important to make sure that users, after making the first payment, do not stop there, but continue to make subsequent payments, since it is often repeated payments that bring the most revenue.
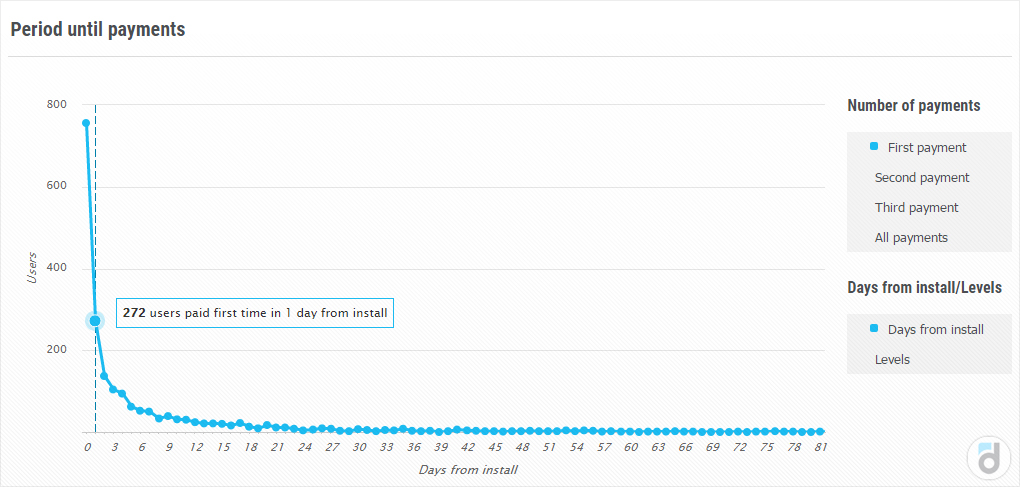
Tracking the time before the first payment is made
It is quite important to understand at what point users start paying – immediately on the first day or after some time after installation, when they understand the project better.
Knowing this, you can find patterns in user behavior, influence it and plan various marketing activities, increasing the likelihood of making a payment.
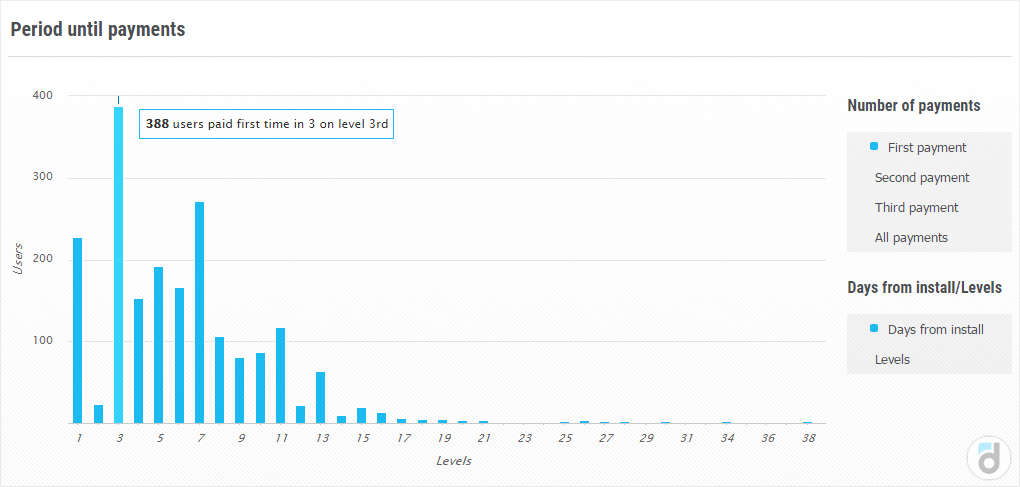
In addition, if there are levels or stages in the application, then it is worth considering the moment of making the first (or any other) payment in the context of these stages. Such a breakdown may be relevant for gaming applications where there are levels, as well as educational products or fitness applications where the user’s progress can be divided into separate stages.
Using cohort analysis to study metrics by day
Conversion is calculated for cohorts, and this feature of it can be used to track its changes over time for a certain group of users, as well as compare different cohorts with each other.
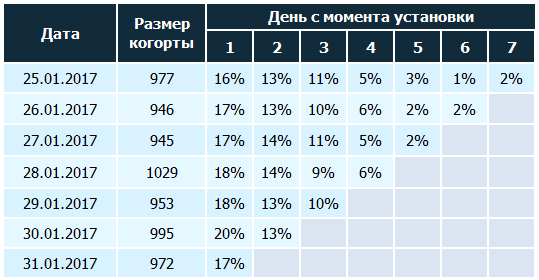
Again, such an analysis is very relevant when conducting experiments – it is possible to assess how the changes affected the conversion of cohorts formed before and after these changes.
There is another metric similar to conversion, but, nevertheless, having a different meaning – this is the share of paying (paying share). However, do not confuse them.
Paying share = Paying users / Active users
This indicator differs from the conversion by the denominator, which is calculated from the entire active audience and is not linked to the installation date, and also does not require cohort analysis.
In addition to the fact that the conversion affects the revenue of the application, it is also an indicator of user interest. Therefore, it would be useful to study their behavior and needs in order to make relevant suggestions to them, develop and improve the product. And remember that when tracking how all these changes affect the percentage of paying users, you must not forget to check other equally important financial metrics.
See also: