What is the difference between ARPPU and ARPU and the average check, why count and track this metric, and also how it is easiest to increase it, said Vera Karpova, analyst at devtodev.
This is the second publication App2Top.ru and devtodev as part of a series of materials about gaming metrics. Articles are divided by seasons, each of which is dedicated to a specific topic. The first season is called “Money”. In it, we talk about performance indicators related to money.
In this article we will talk about the indicator that characterizes the reaction of paying users to the value of the project, and which at the same time is a very important and useful monetization metric.
This is ARPPU (average revenue per paying user) or the average income that a paying user (a user who has made at least one payment) brings for a certain period of time.
To calculate ARPPU, you need to divide the income for the selected period by the number of users who made the payment (Paying Users):
ARPPU = Revenue / Paying Users
Also, when calculating ARPPU, it is important to pay attention to the period under study.
Users can make repeated payments during the month, but the monthly ARPPU will not be equal to the amount of daily ones, since the divisor (paying users for the month) will not be the amount of customers who paid by days, but the number of unique paying users per month.
Unlike ARPU, this metric does not take into account users who have not paid anything: only those who have made a payment are included in the calculation. Accordingly, ARPPU will always be greater than or equal to ARPU (and they will be equal only if all active users make a purchase). In practice, ARPPU is usually significantly superior to ARPU.
A small example to compare these two metrics:
Let’s say 1,000 out of 5,000 active users have made certain in-app purchases worth $3,000. We will calculate ARPU and ARPPU from these data:
- ARPU = $3000 / 5000 = $0.6 – this amount is brought by an active user on average;
- ARPPU = $3000 / 1000 = $3 – and that’s how much the paying person brings to the project on average.
ARPPU has a direct proportional effect on income.
Revenue = ARPPU * Paying Users
By increasing the ARPPU or the number of paying users, you can increase revenue.
But while working on increasing ARPPU, it is necessary to monitor other metrics, since its increase may lead to a deterioration of other indicators.
Let’s take an example of why this can happen.
Let’s assume that 100 users out of 1000 make purchases worth $2. In this case:
- Revenue = $200
- Paying users = 100
- Paying share (the percentage of paying users is the percentage of users who have made a payment from the entire audience) = 100 / 1000 = 10%
- ARPU = $200 / 1000 = $0.2
- ARPPU = $200 / 100 = $2
The easiest way to increase ARPPU is to raise prices. Let’s see how this can turn out.
Let the product now cost $10 instead of $2, but for this price it will be bought not by 100 people, but by 20. Then the metrics will look like this:
- Revenue = $200
- Paying users = 20
- Paying share = 20 / 1000 = 2%
- ARPU = $200 / 1000 = $0,2
- ARPPU = $200 / 20 = $10
In this example, the share of those paying has dropped significantly – from 10% to 2%. But ARPPU grew from $2 to $10, and this did not affect the income, which, like ARPU, remained unchanged.
And if the number of paying users would become even less? For example, 10 instead of 20?
- Revenue = $100
- Paying users = 10
- Paying share = 10 / 1000 = 1%
- ARPU = $100 / 1000 = $0.1
- ARPPU = $100 / 10 = $10
Absolutely all metrics have deteriorated significantly here: income, share of payers and ARPU. But ARPPU would still be equal to $10, as in the previous example.
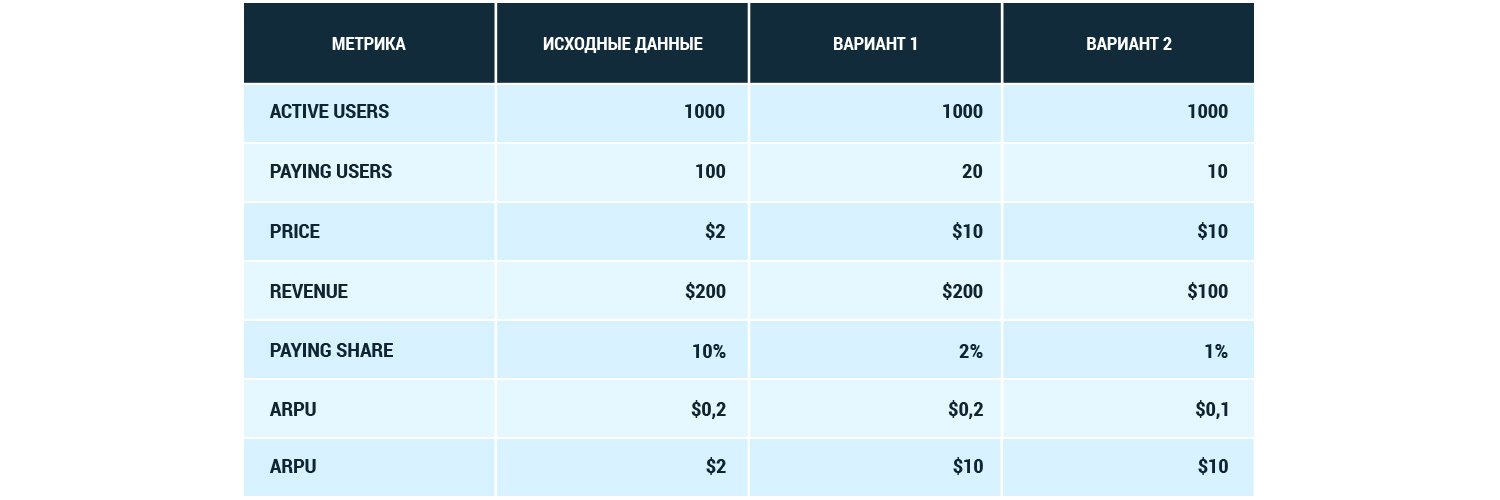
Here is a comparative table of these 3 options:
In this regard, several questions arise: why then is it necessary to count and control ARPPU and how can this indicator be useful?
The fact is that ARPPU characterizes repeated payments very well, since if they are made, the number of those paying does not increase, but income grows.
Perhaps this is the most competent way to increase the ARPPU metric without compromising other indicators.
Let’s take this as an example.
10 users out of 100 made payments, each worth $2.
- Revenue = $20
- Paying share = 10%
- ARPU = $0,2
- ARPPU = $2
Then three of these 10 payers made a repeat payment in the amount of $3. Then:
- Revenue = $29
- Paying share = 10%
- ARPU = $0,3
- ARPPU = $3
That is, repeated user payments lead to the growth of all major metrics.
By the way, devtodev’s research on online games has shown that the more payments a user makes, the greater the amount of his subsequent payment.
There is another metric close to ARPPU – this is the average check (“average check” or “revenue per transaction”), but nevertheless it has a slightly different meaning and differs in the method of calculation, although it is also used only for paying users, or rather, to evaluate their payments.
So, the average check is the average transaction cost, that is, the arithmetic mean of all payments made, without taking into account the number of users who made these payments.
Average Check = Revenue / Transactions
The difference with ARPPU is that if one paying user makes a repeat payment, the denominator in ARPPU (the number of paying users) will not change, but the number of transactions will increase, and this will affect the size of the average check.
Let’s compare these two metrics with an example.
Let’s say 10 users made payments of $5 each, after which two of them made another purchase worth $3.
In this case, ARPPU will be equal to (10 * $5 + 2 * $3) / 10 = $5,6, and in order to calculate the average check, the total income should be divided not by the number of paying users, but by the number of payments made by them: (10 * $5 + 2 * $3) / 12 = $4.7
Perhaps it is interesting to find out what kind of ARPPU successful projects have. Here is one of them – the Game of War game, the annual ARPPU of which was $ 550.
ARPPU is another indicator of user loyalty, which at the same time allows you to evaluate the attitude of users to product prices. He is sensitive to their change. It also shows the satisfaction of users with your application, since the higher it is, the more they will eventually pay.
See also: