What is a cumulative ARPU, how does it differ from a regular ARPU, how to count it and why it is needed, said Vera Karpova, analyst at devtodev.
This is the third publication App2Top.ru and devtodev as part of a series of materials about gaming metrics. Articles are divided by seasons, each of which is dedicated to a specific topic. The first season is called “Money”. In it, we talk about performance indicators related to money.
In this article, we will look at a metric that will be very useful for evaluating the quality of traffic and choosing the optimal CPI indicator. This is a cumulative ARPU (cumulative ARPU).
This indicator is calculated in the same way as a regular ARPU by dividing revenue by audience, but it has one very important feature that distinguishes it from a regular ARPU and makes it useful for traffic analysis.
Cumulative ARPU is calculated not for the entire audience, but exclusively for a certain cohort of users, and this cohort is formed from users who installed the application during a certain period (it is most convenient to use daily or monthly cohorts).
Another feature of this metric is that it increases every day for one cohort (it is not for nothing that it is called “cumulative”).
How does this happen?
Let’s say we decided to investigate the users who installed the application on 01.01.2017, let’s say there were 1000 people. On the first day they made certain purchases, and the income from these purchases was $800. The ARPU of this cohort on the 1st day was $800 / 1000 = $0.8
Let’s start keeping a sign and enter all the available data.

The next day, some of the same users made payments totaling $500. No matter how many of them returned to the project and how many people paid, the size of the cohort into which we will divide the income is always 1000 users.
And now it is already possible to calculate the cumulative ARPU. It will be equal to the sum of the ARPU of the 0th (installation day) and 1st days.

We will count the remaining days in the same way.

Now you can output the final formula by which the cumulative ARPU is calculated.
Cumulative ARPU for N days = Income (of the selected cohort for N days) / Number of users (within the selected cohort)
The cumulative ARPU of the nth day for a certain cohort is equal to the income that this cohort brought in N days divided by the number of users in this cohort.
Usually the cumulative ARPU graph for a cohort looks like this:
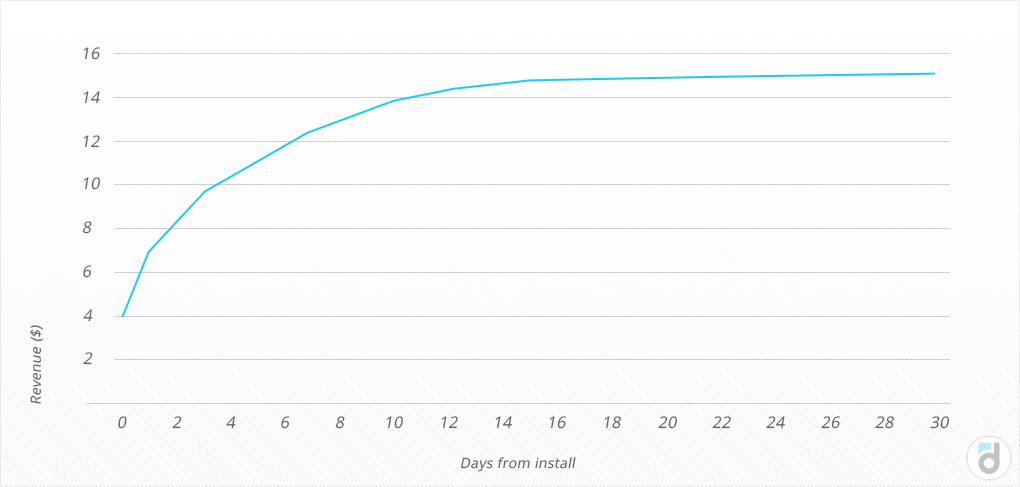
This metric can only grow over time, because the more time users spend on a project, the more they pay. And if at some point they stop paying or using the product at all, this chart, having reached a certain level, will move into a horizontal line.
What is interesting about this metric?
Firstly, knowing it, you will know how much money the user will bring on the 7th or 30th day in the application, or in 3 months. That is, you will be able to calculate when and how much we will bring you a new user.
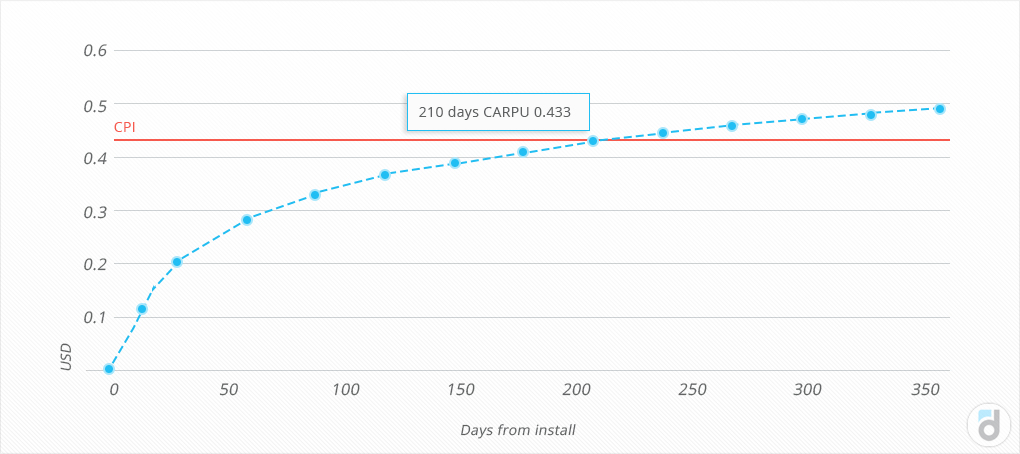
Hence its second advantage. This metric is very useful when evaluating the quality of traffic and its payback period, because it is important to know when a user will start bringing in more money than you spent on attracting him. This will be the moment when the cumulative ARPU becomes equal to CPI (Cost Per Install).
And if you know what the cumulative ARPU of the cohort is, for example, for 365 days (or any other subsequent day), then you can already talk about the average income per user for the entire lifetime in the project (this is the Lifetime value metric, LTV or CLV).
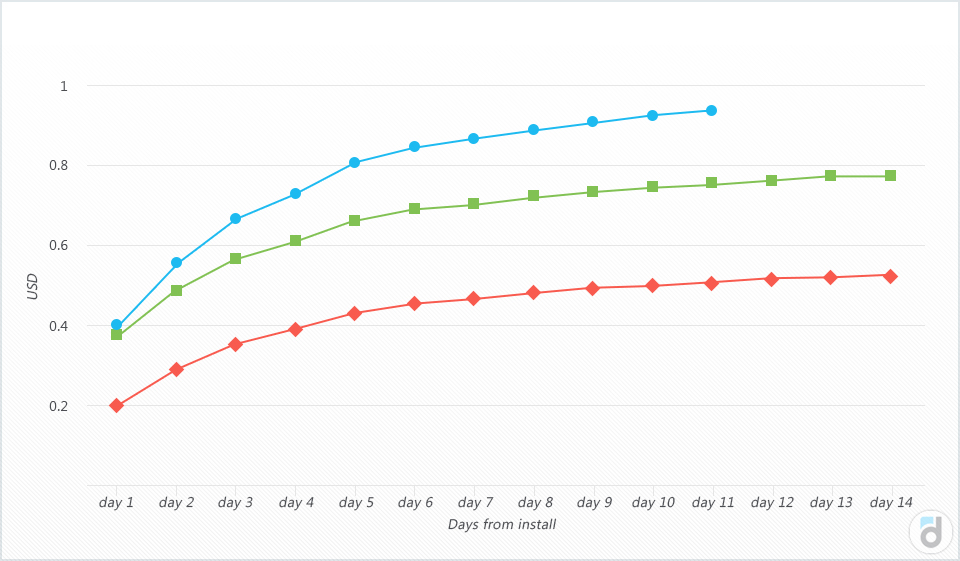
And another advantage of this metric: due to the calculation features, the cumulative ARPU allows you to compare different cohorts, which is especially convenient when you have made any changes to the product.
In this case, you can compare the dynamics of cumulative ARPU for the cohort that installed the application before changes were made to it, with those who installed it after, to find out how these changes affected user payments.
Thus, the calculation of cumulative ARPU is a big step towards cohort analysis, a good indicator of the quality of purchased traffic and just a useful metric for assessing the nature of user payments and their profitability for the project.
See also: