If your game has a store, you should definitely find out what a consumer basket is. How to work with it, – says devtodev analyst Vera Karpova in our series of materials “Performance indicators of games”.
The publication is published as part of a series of materials about game metrics from App2Top.ru and devtodev. Articles are divided by seasons, each of which is dedicated to a specific topic. The second season is called “Users”. In it, we talk about those business metrics that reflect the effectiveness of the application in terms of working with the audience.

Vera Karpova
In the process of using the application, users buy a variety of products to facilitate the further passage of the game, get access to the main content, get some unique content, and so on.
Their choice in terms of products can also be analyzed. And today we will talk about the consumer basket and the purchases that users make during the game, as well as possible options for their analysis.
It is worth noting that the concept of “consumer basket” is used in various fields (most often in the economy). It means a set of goods and services purchased on average by one user over a certain period of time.
The goals and methods of analysis also differ depending on the field, and we will look at how the analysis for game projects might look like.
Let’s say 1000 users got into the application and in the first month they bought the following products:
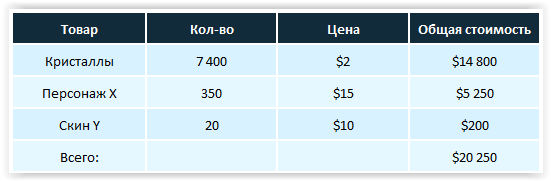
Recalculating these purchases per user, it turns out that the cost of his consumer basket in the first month is $ 20.25, and its composition:
- crystals – 7.4 pieces;
- character – 0.35 pieces;
- skin – 0.02 pieces.
The composition and cost of the consumer basket can be adjusted in various ways, so it is not enough just to calculate these indicators, it is important to track their change over time, since quite a lot of factors can influence this. For example, promotions and discounts on any goods, or, conversely, experiments to increase the price, additional meetings with the purchase, changing the order of goods in the store, visual accents on specific products, changing the complexity of levels or locations, and so on.
Based on the experience of devtodev, it is worth analyzing user purchases in terms of levels and locations.
To begin with, you can simply compare all the purchased items by popularity and see at what point in the game users buy certain goods.
After that, these purchases can be compared with the number of users who are at the same levels / locations, and calculate how many products the user buys on average at a given point in the game.
Knowing which products the user has at a certain level, it is possible to understand what is most in demand and at what moment, which goods / currencies the user has in excess, what on the contrary is not enough, and based on this, decide which promotion and at what moment to launch, on which product to make a discount.
For example, if users have very little game currency by a certain level, which is fraught with a dump, it makes sense to make a promotion for those who have reached this part of the game in order to keep them in the game and increase interest in its further passage.
Another option for analyzing the structure of purchases is ABC/XYZ analysis. Its task is to identify the products that bring the greatest value to the project in order to increase their share among the products purchased. It consists of 2 parts:
ABC analysis distributes goods into groups depending on their contribution to the total income of the quantity among all purchased goods:
- Group A products bring 80% of revenue and make up 20% of the total;
- Group B products account for 15% of revenue and 30% of total quantity;
- Group C products account for 5% of revenue and 50% of total quantity.
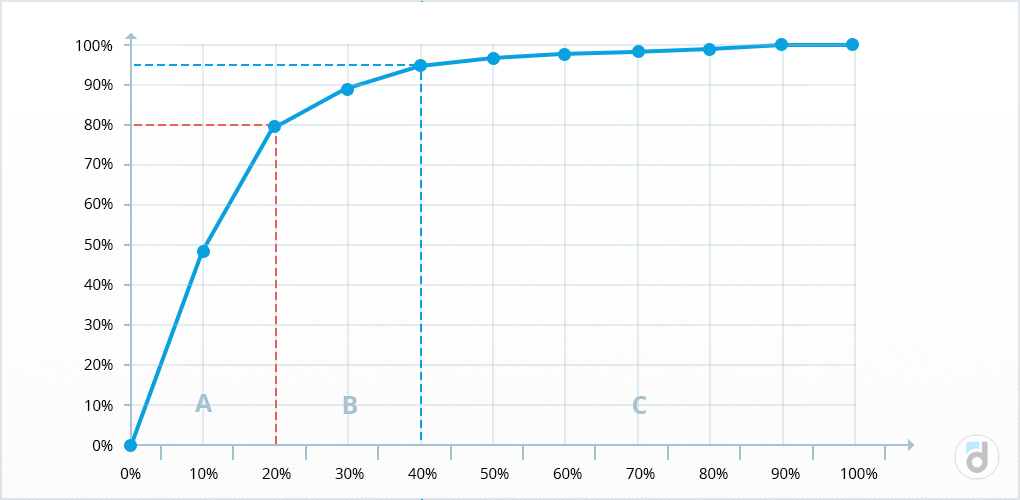
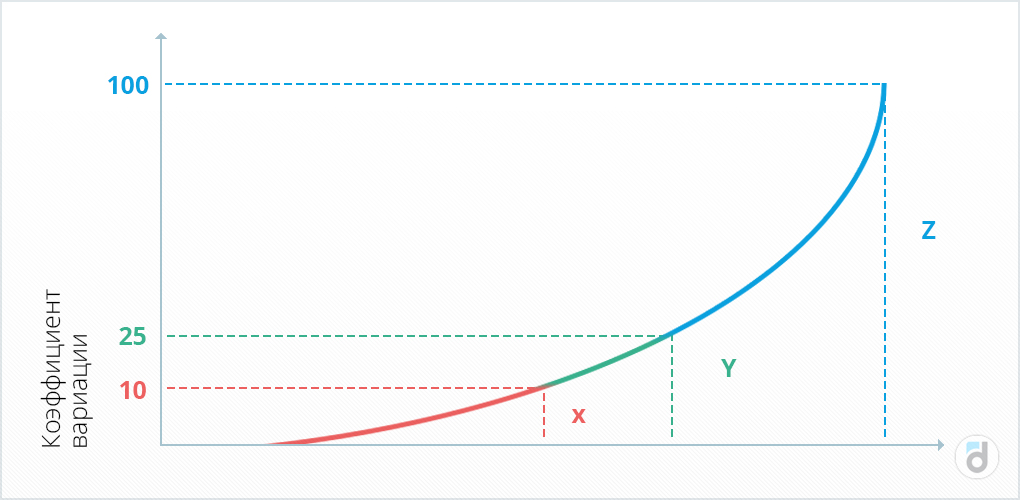
XYZ analysis characterizes the stability of demand (by coefficient of variation) and the accuracy of forecasting:
- Group X – products with the most stable demand, having a coefficient of variation of less than 10% and a high degree of reliability of the forecast;
- group Y – products with medium-stable demand, having a coefficient of variation from 10% to 25% and an average degree of reliability of the forecast;
- Group Z – goods, the demand for which is unstable, the coefficient of variation is more than 25% and it is impossible to make an accurate forecast.
After dividing all products into ABC and XYZ groups, they are combined into one table as follows:
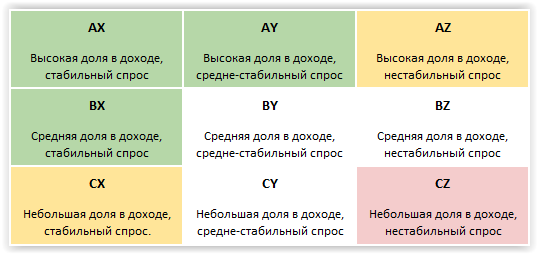
The goods included in AX, AY, BX are the most profitable goods, since they have a stable demand and bring a large share in income. But those that got into CZ may be worth giving up, because they have the worst characteristics. It is worth working with products in the CX and AZ group, since one of their criteria is quite good, and by correcting the other, you can transfer them to a more profitable category.
Often the task of analyzing user purchases is to identify combinations of purchased goods, especially if we are not talking about a game, but some online (or even offline) store. In this case, it is additionally worth analyzing a set of products purchased by the user as part of a single purchase.
After that, you can ask yourself why exactly such a set of goods was purchased, what is the pattern between these sets of goods, with what probability the user who bought product A will buy product B.
Knowing the most popular combinations, you can change the location of goods or the order of their display in the store, make discounts on related products, make the necessary goods more visible, or even abandon some goods in favor of new ones.
For example, if wine and cheese are often found in buyers’ receipts, then it may make sense to place these two goods next to each other so that someone who wanted to buy only wine noticed cheese and bought it too as the most suitable product.
In addition, such information will allow you to conduct personalized promotions for related products, push notifications, email newsletters, thereby increasing the average user’s receipt.

Read also materials about other metrics: