How can active users be counted and by what criteria, as well as what statistical anomalies occur when evaluating the audience, – says devtodev analyst Vera Karpova.
The publication is published as part of a series of materials about game metrics from App2Top.ru and devtodev. Articles are divided by seasons, each of which is dedicated to a specific topic. The second season is called “Users”. In it, we talk about those business metrics that reflect the effectiveness of the application in terms of working with the audience.

Vera Karpova
Every day the project audience is replenished with new users. Some of them quickly lose interest, someone sometimes remembers about the application, and someone uses it regularly. And for sure, representatives of all these segments visit the application every day. Today we will talk about them – Active users.
Active users are those who have had at least one session during the time period under study. These intervals may be different, but most often they study the daily, weekly, and monthly audience of the project. And these indicators have well-established names:
- DAU – number of unique users per day (daily active users);
- WAU – number of unique users per week (weekly active users);
- MAU – the number of unique users per month (monthly active users).
At the same time, you can make similar calculations for any other periods, if they better meet the requirements of the company. For example, summing up the results of the outgoing year, you can calculate the annual audience of the project and compare it with previous years to assess the dynamics.
It is worth noting that the WAU for a certain week is not the amount of DAU for 7 days, since we are talking about unique users. For example, one of them can log into the application on Monday and Tuesday, and it will get into both Monday’s DAU and Tuesday’s DAU. But within a week (from Monday to Sunday) it will be counted only 1 time.
Similarly, MAU is not the sum of 4 WAU and 30 DAU. From the point of view of calculation, these indicators are not related to each other and are calculated separately.
To better understand these indicators, let’s calculate them using an example.
Let’s say we have data on visits to the application by various users for 2 weeks. At the same time, it does not matter how many times a day the user visited the project, since he will still be one unique visitor.
Blue marks the days when users logged into the app.
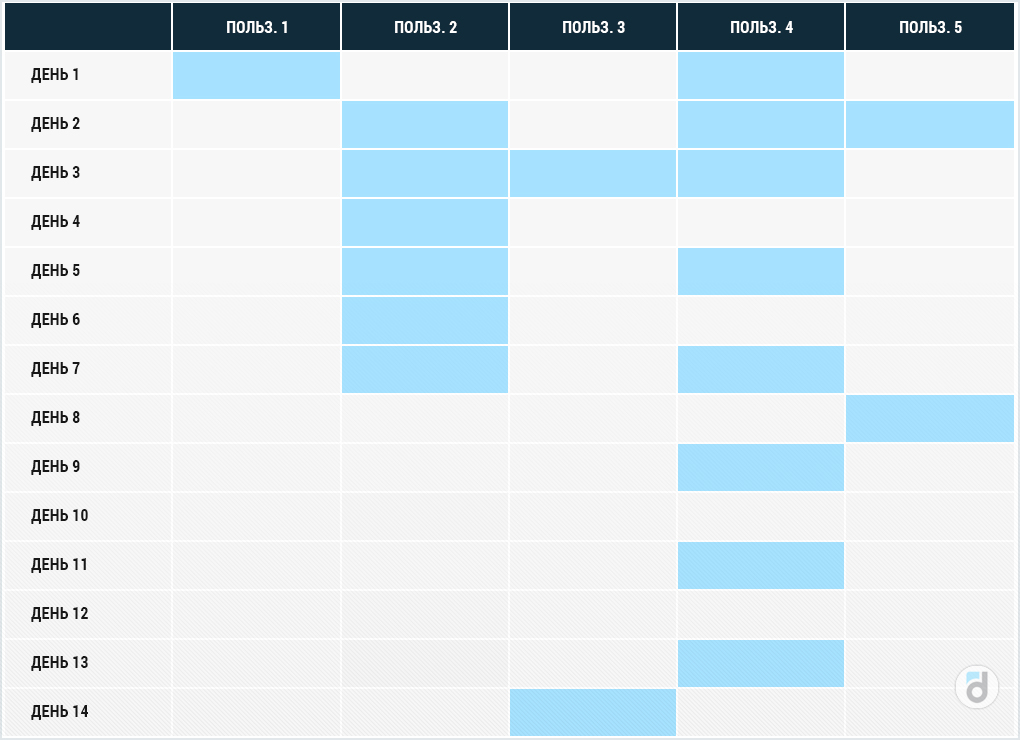
So, first calculate the DAU for the 1st, 2nd, 5th and 10th day. To do this, you need to know how many unique users have logged into the app these days:
- Day 1 DAU = 2 (users 1 and 4);
- Day 2 DAU = 3 (users 2,4,5);
- DAU of the 3rd day = 3 (users 2,3,4);
- DAU of the 10th day = 0 (no one logged into the app these days).
Next, we calculate the WAU:
- in the first week (from the 1st to the 7th days) it is equal to 5 – all users logged into the project;
- in the second week (from the 8th to the 14th day), this indicator has already been 3 – the first and second users did not do sessions.
You can also choose an arbitrary week, for example, from the 3rd to the 9th day, and then the WAU will be equal to 4.
Similarly, you can count active users for a month, for six months, and for other time intervals.
In our example, only 5 people participated, and in a real project it will be thousands, hundreds of thousands, millions of users who visit the product every day. And the way they enter the application speaks about its stability, quality and scale.
In addition, Active users is an indicator that makes sense to monitor in real time, because if something breaks in the application or on the server and users cannot use the product, it will immediately affect this metric. For such control, users can be grouped not by days, but by hours or even 10-minute intervals.
By the way, active users who are currently in the application are a separate metric that has its own name. Most often these are Users online, but you can also find abbreviations such as CCU (concurrent users) – users who are in the application at a certain moment, and PCCU (peak concurrent users) – the maximum number of users who are in the application at the same time.
The average CCU reflects the scale of the project well, and the PCCU is very important when planning the load on the servers.
The dynamics of active users can change not only within a day, it can gradually grow or fall month by month. And it is quite important to control it. Segmentation helps simplify the analysis of changes in the number of active users. Thanks to it, you can quickly understand at the expense of which segment of users the indicator is changing.
Here are a few options for segmenting the active audience.
For payments:
- paying / not paying
- who made only 1 payment / made repeated payments
By the time from the moment of installation:
- 1 day / 2-7 days / 8-14 days / 15-30 days / 30- 60 days / 60+ days
According to the regularity of visits:
- every day / 4-6 times a week / 1-2 times a week / once a month or less
And you can also divide by countries, by devices, operating systems, by custom event (that is, divide the audience into users who performed and did not perform this or that action).
The latter option of segmentation can be used if there is any key event in the application that is important for the completeness of the gaming experience or creating the right first impression of the product (for example, passing training, N levels in the game or entering the store).
When you identify the segment in which there is a decrease in active users, it will be easier to look for a possible cause of the problem.
Here’s what kind of situation can happen:
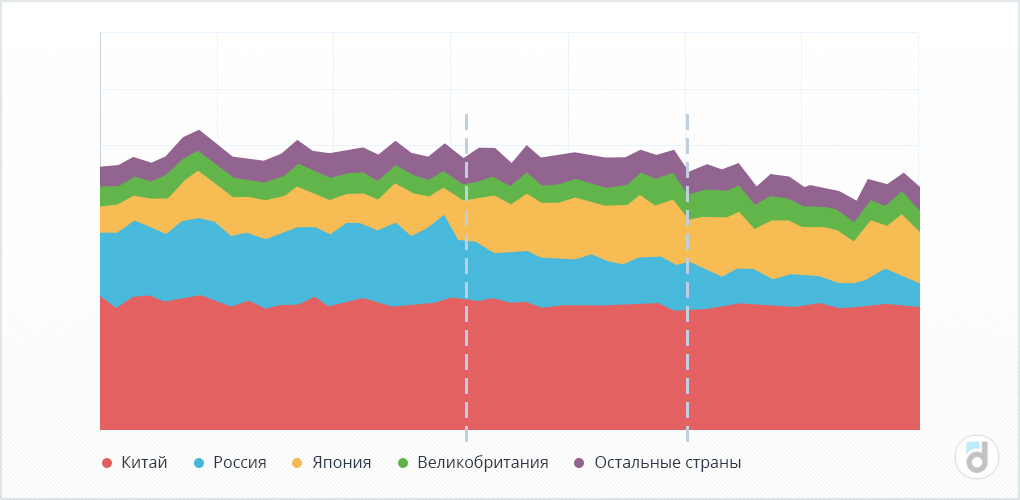
First, the number of active users in Russia begins to decrease, at the same time the number of visitors from Japan increases and they compensate for the drop in another country. If we look only at the general DAU chart, we are unlikely to notice any changes in dynamics. And only then, when the number of active users in Russia drops even more, we will see it on the general graph. Meanwhile, a lot of time will have already passed, which could be used to find and eliminate the cause of the fall.
Another statistical anomaly confirms the importance of segmentation is the Simpson paradox. Its manifestation is best considered by an example.
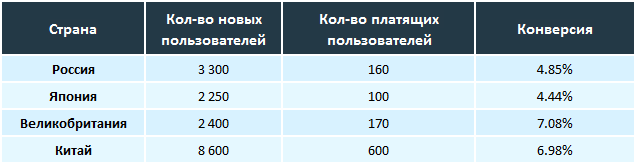
Let’s take 4 countries from the previous example and assume that the conversion to purchase in them is as follows:
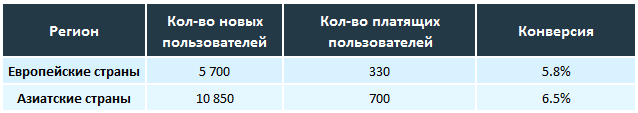
Next, we will calculate the total conversion of European and Asian countries:
And that’s what happens:
- The conversion rate in Russia (4.85%) is higher than the conversion rate in Japan (4.44%);
- The conversion rate in the UK (7.08%) is higher than the conversion rate in China (6.98%);
- the total conversion of European countries (5.8%) is less than the conversion of Asian countries (6.5%).
This once again suggests that segmentation may not give the same results as the overall statistics of the indicator.
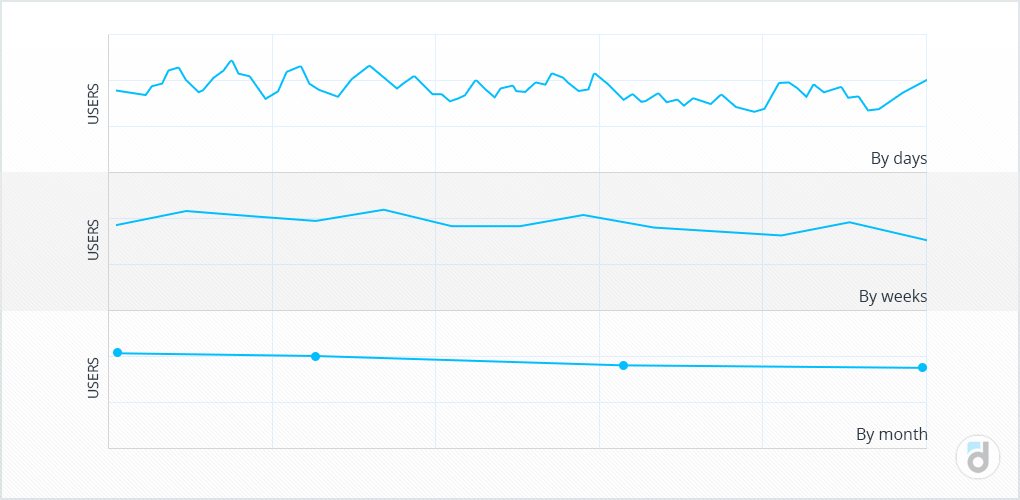
By the way, sometimes looking at the DAU chart, you can’t always clearly identify the trend, but grouping by weeks or months (converting the chart to WAU and MAU) makes it more explicit.
By itself, the Active users metric is certainly important for the project, but in addition it is also associated with other financial and behavioral metrics.
First of all, Active users are affected by the number of new users – the more of them, and the faster and more stable they come to the project, the faster the audience grows.
The second equally important indicator is Retention, which indicates how users return to the project. If you bring new users to the project who will not return to it, they will not replenish the audience, and such attraction will not have any effect. It is important to get users interested in the product so that they want to come back. And the more of them there are, the more active the audience will be.
A small example:
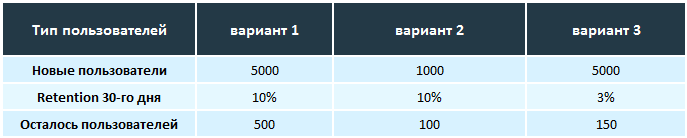
You can have good Retention rates in the application, but with a small number of new users, the audience will grow very slowly. Conversely, if there is a good influx of new users and low Retention, then most of them will leave the project, which will also not increase the audience.
And the larger the audience of the project, the more potential payers among it. After all, it is in this sequence that users become paying:
New users → Active users → Paying users
By the way, it is important that the user remains active in the product after making the first payment, because this will increase the chances that he will make repeated purchases.
Thus, Active users directly proportionally affects income:
Revenue = Active users * Paying share * ARPPU
The number of active users is one of the most important indicators of the product, which indirectly indicates its success, combining both the quality of attracting new users and retention metrics, directly affecting revenue. Therefore, when analyzing active users, you should also pay attention to the growth rate of the audience, because this metric is one of the most positive signs of active product development.
See also: