The metric that allows you to track the loss of audience in the product is called Churn rate (it is also the outflow of users). How to work with it, – says devtodev analyst Vera Karpova in our series of materials “Performance indicators of games”.
The publication is published as part of a series of materials about game metrics from App2Top.ru and devtodev. Articles are divided by seasons, each of which is dedicated to a specific topic. The second season is called “Users”. In it, we talk about those business metrics that reflect the effectiveness of the application in terms of working with the audience.

Vera Karpova
In this article we will talk about an indicator that affects not only financial metrics, but also the possibility of company growth. This Churn rate is an indicator of user churn, one of the most important product metrics. The size of the product audience depends on it, and, accordingly, income: after all, the larger the audience, the more paying users there are in it.
Where to use and how to calculate Churn rate?
Churn rate is quite often used as an auxiliary metric for calculating financial metrics such as Lifetime and Lifetime value. However, it is also important in itself: if users leave the application and this outflow is not covered by new users, then the audience of the project will gradually decrease.
Outflow is calculated in users – how many of them left the service. And here it is important to determine which user is considered to be gone – who was inactive for 7, 14, 30 days, several months, or even a year?
This period is selected individually depending on the type of application. Important: the selected period greatly affects the final Churn rate: the shorter the selected user inactivity time, the faster the metric will respond to changes, but also the less stable it will be.
Another way to calculate Churn rate, which is mainly used for subscription services, is to calculate “fallen off” subscribers. This Churn rate is most often calculated as a percentage using the following formula:
Churn rate = (number of users at the beginning of the period – number of users at the end of the period) / number of users at the beginning of the period * 100%
For example, at the beginning of the month there were 200 subscribers, and only 180 of them renewed their subscription for the next month, it turns out that the outflow was 10% ((200-180)/200*100%). At the same time, new users who have subscribed this month are not counted.
Such outflow is usually calculated by months, quarters or years for applications with a subscription, but nevertheless, this metric can be calculated for any type of application for an arbitrary period, only then the formula will not contain subscribers, but any users who have left the service, for whom a period of inactivity in the application should be determined, which will be a sign of a dump.
If we are talking about lost subscribers, then the Churn rate can be calculated in monetary terms (then it is called MRR Churn rate):
MRR Churn rate = (MRR for the previous period – MRR for the current period) / MRR for the previous period
Here MRR, monthly recurring revenue, is a regular monthly income (most often from subscriptions).
This indicator indicates how much money was lost during the calculation period.
Let’s look at an example of what is the difference between the outflow of users and the outflow of funds.
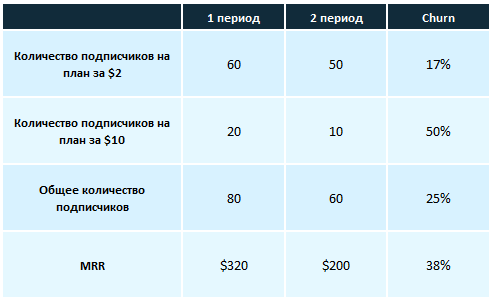
Despite the fact that the number of users decreased by 25%, the losses in money turned out to be much greater – 38%, so it is important to track both indicators.
It is worth considering that in this case, when it comes to subscriptions, the outflow may be not only the departure of the client, but also the transition to a cheaper tariff plan, as a result of which this user begins to pay less, while remaining in the service.
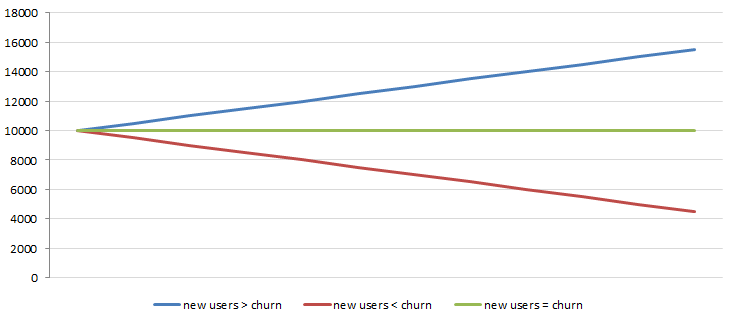
Churn rate is often compared to a leaky bucket: you pour water into it (new users), and it flows out through holes in this bucket (outflow), and in order for water to be in it (the audience of the project), you need to reduce outflow, or pour a lot of water, which can be costly.

Since it is possible that a lot of new users come to the application, but they do not stay for a long time (the outflow is much greater), there is no one to pay and it turns out that the efforts spent on attracting do not pay off, and this will necessarily affect income.
Consider this example: the product already has a certain number of paying users, we are buying new ones, but at the same time there is an outflow and this is how it affects financial performance:
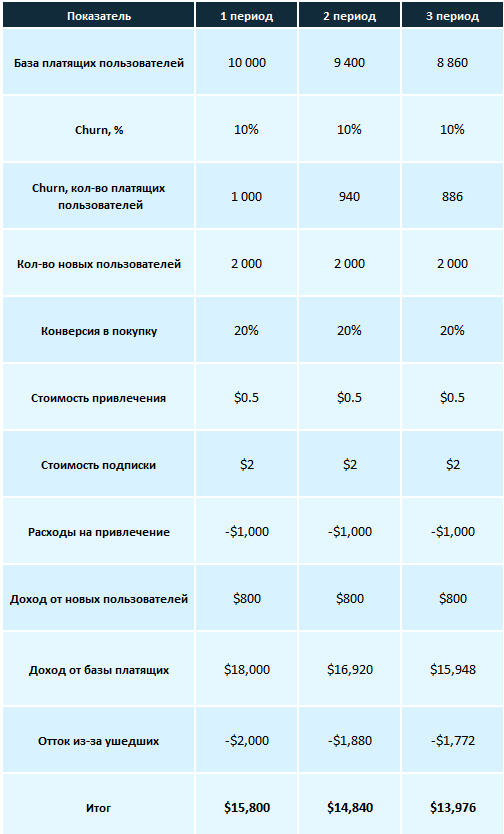
In order to correct the declining trend in this example and make the income increase from period to period, you can:
- reduce the cost of attracting users, although in this example, even if their cost is zero, the trend will still decrease;
- increase the conversion to purchase of new users (to equalize the trend by at least 150%, to a value of 50%);
- reduce the Churn rate (by 60%, to a value of 4%).
As you can see in this example, Churn rate requires less changes than other metrics.
In addition to the general Churn rate, you can additionally calculate the Churn rate at a certain stage of the user’s work with the application. This approach is most relevant for games and educational applications where there are any levels or stages that the user must pass.
For example, this way you can see how users “fall off” at various levels in the game.
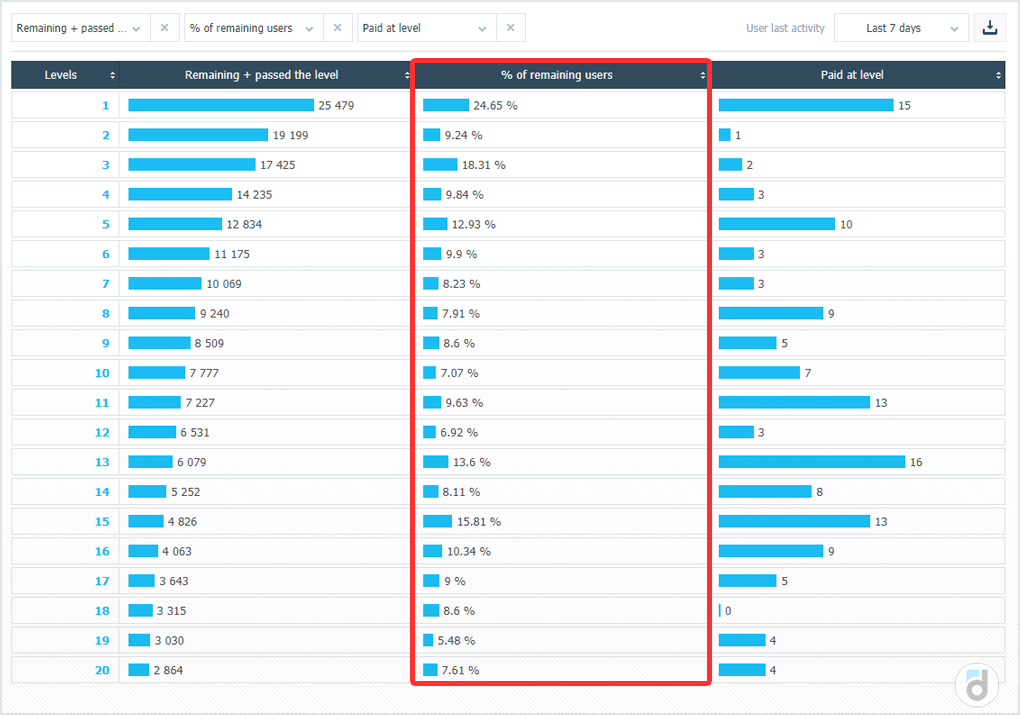
Or even on the steps of the tutorial.
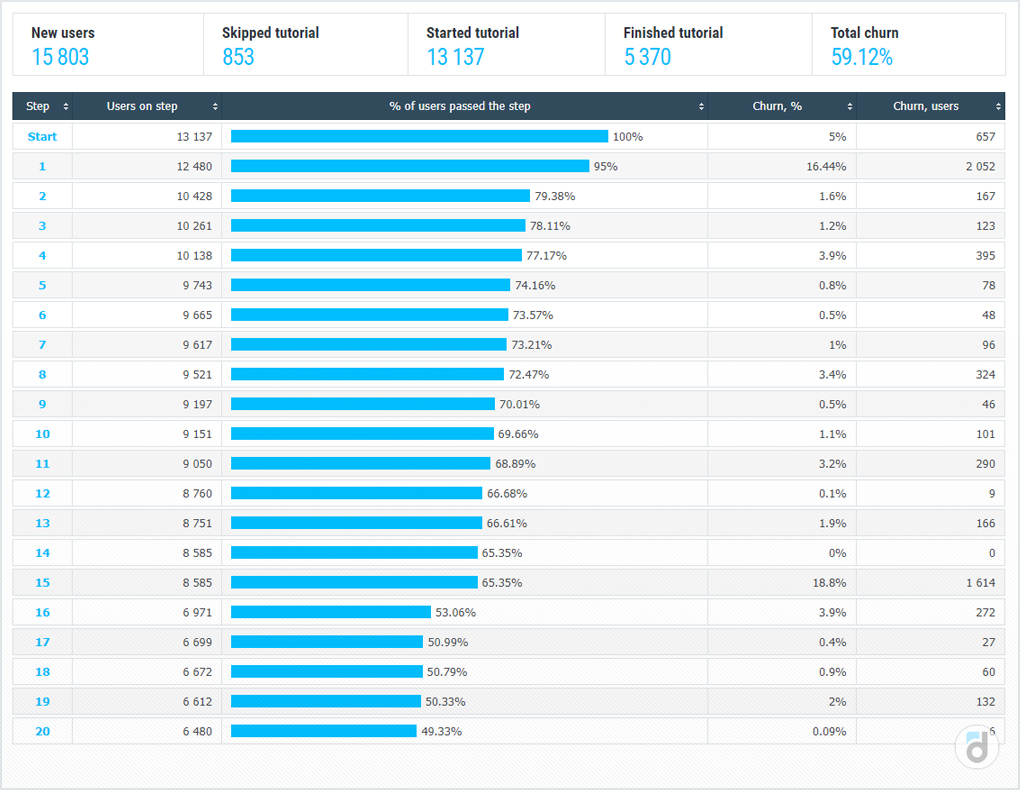
Based on our experience, knowing where users leave, we can experiment at these specific points to prevent outflow there and keep users in the product.
What can cause an outflow of users?
Perhaps, first of all, it is the quality of the product, its convenience and usefulness for the user. If the product solves the customer’s tasks, then this will positively affect the outflow.
If the needs remain unsatisfied, there is a chance that the user will go looking for another product to solve their problems.
The outflow can be influenced by the price, especially if it is quite high compared to competitors. But at the same time, if the user has already evaluated the product and is used to using it regularly, then the price may not be the deciding factor.
The influx of a non-target audience can increase the Churn rate, because in this case, users whose expectations are unlikely to coincide with what they will receive by downloading the application will get into the application.
Launching an application in a crowded market, where there are already many similar products that have won their audience, can lead to an outflow, because potential users have already formed a vision of a product suitable for them, and there are many alternatives around.
If this is a game, then the high or, conversely, too low complexity of its passage will lead to the fact that users either will not get the joy of overcoming the levels or will get bored after going through several stages.
The appearance of a new provider of the same services on the market can lead to a decrease in the audience, especially if it has a more attractive price.
A large amount of advertising while working with the product or periodically occurring errors can also cause churn.
How to reduce Churn rate?
Methods of dealing with outflow follow from the possible causes described above. And it would not be superfluous to understand what exactly leads users to churn, and at what point it happens; does the user perform the targeted actions of the product, does everything go smoothly for him?
In addition, this is the inverse metric for Retention: in order for users not to leave the project, you need to think about how to make them return. There are several ways to do this.
- To create the right impression during the first session in the application: often it is on her that the user will return or not, it is she who determines the Retention (and, accordingly, Churn) of the following days. Therefore, the first session should be used to show the user the capabilities and advantages of the application as well as possible, to interest the product.
- Study user reviews of the application to understand what they are dissatisfied with, what is missing.
- Remind users about the product, inform them about new features, bonuses, personal offers through push and email notifications.
- If it’s a game, vary the difficulty to keep the players interested.
- Be better than competitors, study customer needs, change them, develop and improve the product.
Churn rate is a very important metric for any product, because it determines the size of the audience, indicates the relevance and clarity of the application for users and directly affects revenue. Therefore, the efforts spent on working with outflow will definitely give a result in the form of an increase in financial indicators.