What is loyalty, how to calculate it, why it may be needed? These and other questions are answered by devtodev analyst Vera Karpova in our series of materials “Performance Indicators of games”.
The publication is published as part of a series of materials about game metrics from App2Top.ru and devtodev. Articles are divided by seasons, each of which is dedicated to a specific topic. The second season is called “Users”. In it, we talk about those business metrics that reflect the effectiveness of the application in terms of working with the audience.

Vera Karpova
When a developer creates his product, he tries to make it useful, convenient and in demand for users. And when the user becomes loyal to the product, it increases the likelihood of making a payment, as well as the fact that he will leave a good review and recommend the application to friends.
And one of the indicators by which this loyalty can be assessed is the consumer loyalty index – Net Promoter Score, or NPS for short.
But this metric is not completely trivial and to calculate it, you need to conduct a survey among the users of the application beforehand.
It consists of just one question, the wording of which is always the same and does not depend on either the field or the type of product or service. It sounds like this:
How likely is it that you would recommend our company/product/service to a friend or colleague? (What is the probability that you will recommend a company/product/brand to your friends/acquaintances/colleagues?)
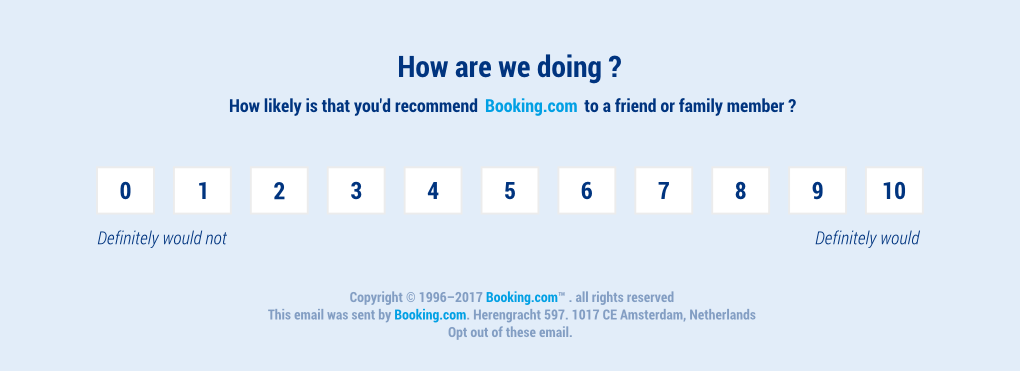
Next, you need to give the user the opportunity to select a score corresponding to this probability on a scale from 0 to 10.
Here is an example of how the Booking survey does:
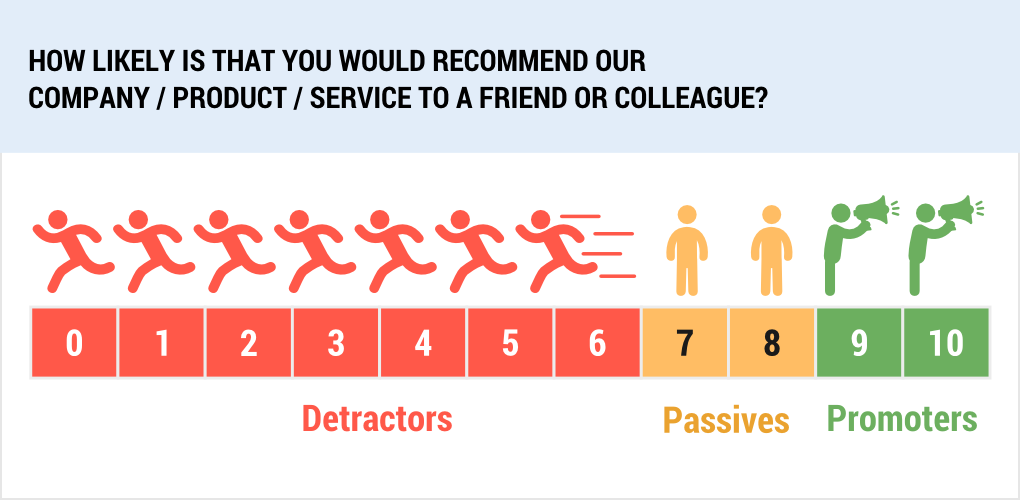
This is the end of the NPS study, it remains only to process the result. To do this, users need to be grouped depending on the rating set:
- those who put a score from 0 to 6 are critics (detractors) – dissatisfied users who are likely to leave a negative review about the product and will not tell their friends anything good about it;
- those who scored 7-8 points are neutral, indifferent users (passives) who can stop using the product at any time and go to competitors;
- those who put 9 or 10 points – promoters (promoters) — loyal customers, fans of the product, who usually leave positive feedback and spread only good information about it.
Next, in order to calculate the NPS, we substitute the obtained values into the formula:
NPS = % promotes – % detractors
The net promoter score calculation itself is quite simple. Let’s say the users responded as follows:
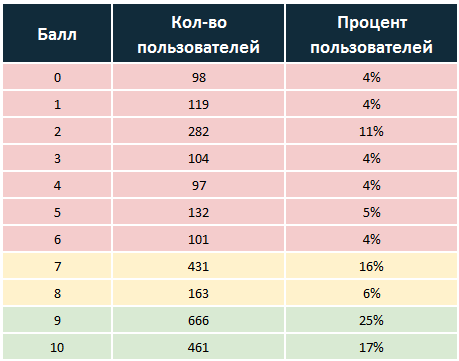
We summarize detractors and promoters and find the difference between them: 42% – 35% = 7% – this is the consumer loyalty index.
The NPS value can be not only positive, but also negative when critics prevail in the project. Of course, this is not a very good situation for the project, because in this case there is a risk of losing the audience due to a large number of negative reviews from critics. While a positive NPS indicates that the project has a lot of loyal supporters, which increases the chances of audience growth due to virality.
Sometimes the NPS survey is accompanied by an additional question that allows you to better find out what exactly users like or dislike about the product:
What’s the most important reason for your score? (What is the reason why you put such a rating?)
The user gives the answer to it already in free form.
There are several nuances to keep in mind when measuring NPS.
When conducting such surveys, it is worth considering the most appropriate place and time. If you interrupt a user while playing or placing an order, it is unlikely that he will be very happy to participate in the study.
In this situation, he is more likely to either close the survey form or give a slightly lower rating than he would have if he had encountered this survey at a more appropriate time.
If, for example, you show the survey form after making a purchase, then this will immediately limit the audience, since only paying users will see it. In this case, there is a possibility that the evaluation will depend more on the convenience of the purchase process than on the product as a whole.
Thus, the place in the application where the survey will be shown may affect the user’s assessment, so it is worth choosing neutral moments when he is not focused on any process inside the application.
Perhaps there is no ideal place for such a survey, but the most suitable one is best chosen by the developer himself, who knows his project well and is already familiar with the behavior of users in it.
The second point to pay attention to is how often to conduct a survey.
As with the “ideal” location, and with the frequency of surveys, there is no unambiguous answer. You can hold it once a month, quarter, half a year, year – only when choosing this period should you take into account how quickly the audience is updated.
The fact is that a user who has already participated in the survey will most likely not give points every month.
It is likely that when you run the survey for the first time, completely different users will take part in it – both those who have been in the application for a long time and “beginners”. After some time, the audience of the project will be replenished with new users and when the survey is launched again, there is a chance that the new ones who came after the first survey will respond to a greater extent.

And at this time, the “old” user, who last time put 9 points, is not so happy with the latest updates, but he will not participate in the survey for the nth time. And his opinion will not be taken into account when calculating the NPS.
Segmentation will partially help solve this problem – if you run the survey only for a specific audience. Or, when analyzing the results, you can additionally take into account which user set a certain score.
There is also an opinion that initially more loyal users interested in the product will take part in such a survey. But, having more data on the surveyed users at hand, we can assume whether this is the case, for example, by estimating the duration of sessions, the frequency of visits and other behavioral metrics.
It turns out that the calculation of loyalty through NPS has several drawbacks that make it not entirely accurate. However, based on our experience, this indicator can be useful and that’s why:
- First of all, NPS will help to understand the general mood of the audience – which group of users prevails in the project, as well as to draw a conclusion about the growth prospects of the product.
- NPS can be compared with other companies or with industry benchmarks. This is just one of the few indicators for which you can easily find these benchmarks (here is one of the recurses – npsbenchmarks.com ). By making such a comparison, you can understand at what level the product is relative to competitors and which NPS is worth focusing on.
- By measuring the net promoter score at certain intervals, you can assess how the changes made in the product affect customer loyalty, whether the project is moving in the right direction.
There are several analogues of NPS, but they are also based on a user survey. One of them is the Customer Satisfaction Score (CSAT), where users must answer the question “How would you rate your overall satisfaction with the service you received?” on a 5–point scale (very unsatisfied/unsatisfied/neutral/satisfied/very satisfied) (How would you rate your overall satisfaction with the service you received?). After that, the percentage of satisfied users is calculated – those who chose 4 or 5.
Another method, Customer Effort Score (CES), allows you to estimate how much effort is required by users to solve their question when using the product. It exists in 2 variants. In the first case, the question is: “How much effort did you personally have to put forth to handle your request?” (How much effort did you personally put into making the request?) and the answer should be given on a 5-point scale. The second formulation is: “The organization made it easy for me to handle my issue” (The organization made it so that it is easy for me to solve my problem) and you need to answer by choosing the most suitable of 7 options: Strongly disagree, Disagree, Somewhat disagree, Neutral, Somewhat agree, Agree, Strongly agree.
Then the arithmetic mean of all the scores is simply calculated.
Since the methodology of all these surveys is the same, but only the wording differs, then some disadvantages, such as choosing the optimal location and frequency, are also relevant here.
From the point of view of the impact of the NPS level on revenue, we can say that not always a high NPS means a good level of application revenue, but at the same time, successful companies often have a fairly high NPS due to a large number of promoters among users.
In addition, it is worth paying attention to the fact that if the user replied that he is ready to recommend the service, it does not mean that he will do it, so it is also not worth counting on viral growth, looking at NPS. The best way to increase this indicator is to work on the product, improve it and listen to the opinion of its users.

See also: