The indicator that allows you to assess the stability of the user base is called “Stickiness” (“Sticky Factor”). Is there a correlation between it and the revenue of the game, – says devtodev analyst Vera Karpova.
The publication is published as part of a series of materials about game metrics from App2Top.ru and devtodev. Articles are divided by seasons, each of which is dedicated to a specific topic. The second season is called “Users”. In it, we talk about those business metrics that reflect the effectiveness of the application in terms of working with the audience.

Vera Karpova
New users log in to the app every day.
Some of them will never use the product again, and some will come in every day. And in many ways, the income of the application depends on how they behave in the product, how interested they are, because the more loyal users are, the more they are inclined to make payments.
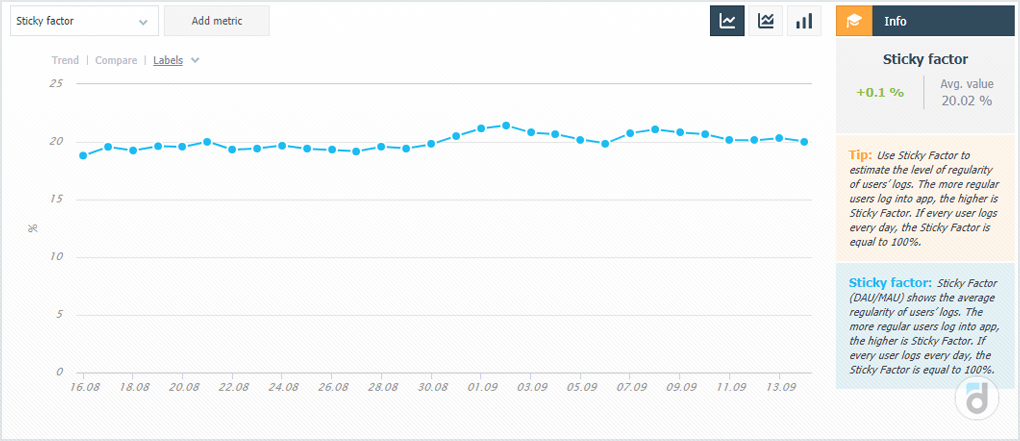
Interest, loyalty and the degree of user engagement characterize several metrics, one of which is the “Sticky Factor” (also “Stickiness Factor”, usually translated into Russian as “Stickiness”) – an indicator that allows you to evaluate the regularity of visits and the stability of the user base.
It is usually calculated as the ratio of the number of unique users per day to the number of unique users per month.
Sticky Factor = DAU / MAU * 100%
But it happens that the ratio of DAU to WAU is used.
Let’s take a closer look at how this metric works.
Let’s say 1,000 unique users log into the application every day, that is, the DAU of the project is 1,000.
If these are different users every day, then the MAU in this case will be 30,000 and the “Sticky Factor” will be equal to 1 000 / 30 000 = 3%. This is the minimum value that this metric can take, and it says that users do not linger in the application, probably its retention is very low and it lacks the user base that is necessary in order to generate revenue for the application.
The reverse situation is when users use the product daily and with a DAU equal to 1,000, the MAU of such a project will also be 1,000, and the “Sticky Factor” is 100%. Of course, there is no such utopia in reality, and this indicator usually strongly depends on the genre and purpose of the product. For example, about 20% is considered a good “Sticky factor” for games, and for social networks and messengers it is usually about 50%.
We at devtodev have previously analyzed the values of the “Sticky factor” for games and found out that it ranges from 4 to 37%, and the average is just 18% (you can read more about this study here).
The “Sticky Factor” shows how likely a new attracted user is to stay in the product, how well the product retains and “hooks” users.
It makes sense to track this indicator at different time intervals for one product in order to assess how certain changes affected the metric, compare it for different user segments, compare its value during a/b tests to better understand which elements affect user interest.
To increase the “Sticky factor”, you can use the same techniques as when working with retention, because the task is to interest the user in the product and make him use it again and again. This can contribute to:
- attracting a target audience that will initially be focused on the proposed product and its functionality;
- creating valuable and relevant content that will make the user come back to the project again and again;
- the user-friendly interface of the application and its richness of useful tools and features;
- a social moment when there is something to share in the application, with whom to share and discuss;
- reminders about the product (in the form of “email” or “push notifications”) and interesting changes in it.
Despite the fact that the “Sticky Factor” is not directly related to income, it characterizes the loyalty and activity of the audience, which in turn affects monetization and income, since the more stable and interested the user base, the faster the product audience is formed and growing, and the larger it is, the more payments users make. Plus, as our experience shows, there is a correlation between the “Sticky factor” and income (it is about 50-60%), which confirms the influence of this indicator on the financial metrics of the product.

Read also materials about other metrics: