The paying player is a welcome player. But this does not mean that the audience can be divided only into those who squeeze and those who pour funds. The payers are also different. How and why to divide them into segments, – says the analyst devtodev Vera Karpova in our series of materials “Performance indicators of games”.
The publication is published as part of a series of materials about game metrics from App2Top.ru and devtodev. Articles are divided by seasons, each of which is dedicated to a specific topic. The second season is called “Users”. In it, we talk about those business metrics that reflect the effectiveness of the application in terms of working with the audience.

Vera Karpova
The audience of any project is quite diverse, but if the product provides for any payments, then it is obvious that there will be two types of users in it: paying and those who have not made a single payment.
Often, the behavior of these groups in the product differs not only in the presence or absence of payments, but also in other behavioral metrics.
In addition, paying players are usually divided into several more types, and they will be discussed in the article.
Segmentation by total amount of payments
Traditionally, there are three types of users among the payers, depending on the amount they paid:
- Whales (whales)
- Dolphins (dolphins)
- Minnows (minnows)
We at devtodev have added two more categories – Grand Whales (grand whales) and Grand Dolphins (Grand dolphins) for better detail.
Whales are users who pay large sums. Most often, they make up a small percentage of the paying audience, but bring a large share of income.
Dolphins make medium-sized payments, and minnows pay very small amounts and their share in total income is often quite insignificant, but these users are the most among those paying.
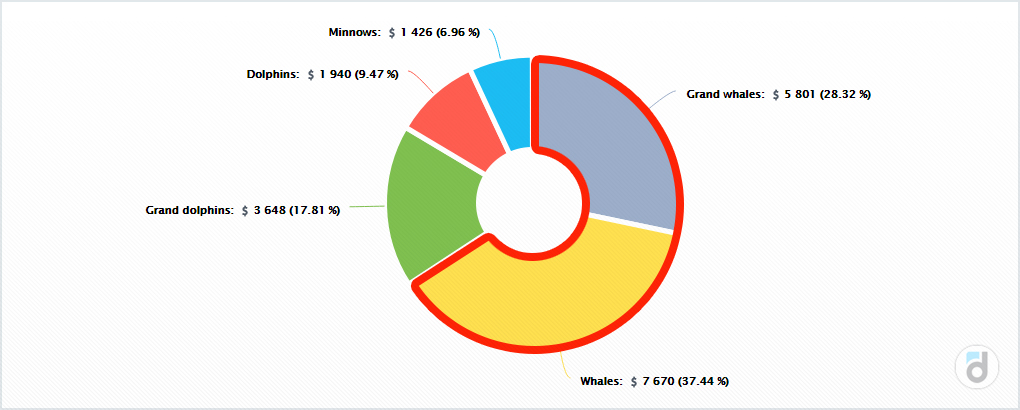
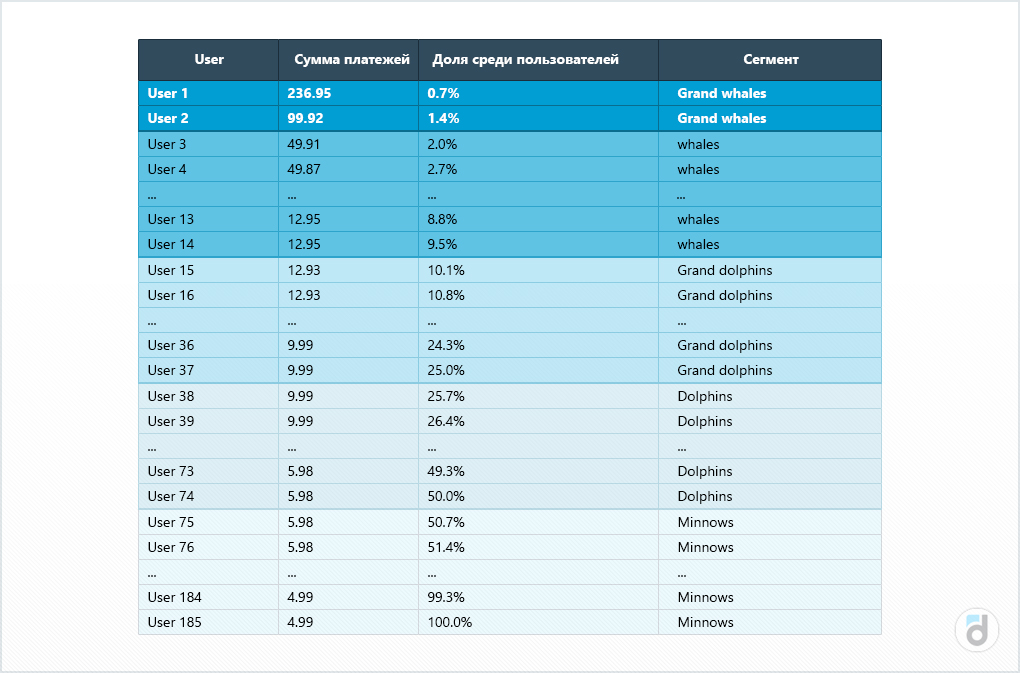
There are several ways to divide users into these types. The first method that we use is the allocation of quantiles, that is, the separation of the sample values into several specific parts. To do this, users are sorted in descending order of income, and then the top 1% is allocated – this is Grand Whales, then 2-10% – Whales, from 11% to 25% – Grand Dolphins, and so on.
Here is an example of how such segmentation can be done:
Another option is to set the boundaries in an expert way: to decide that those who pay $1000 are whales, $100 – $999 are dolphins, and so on. This is a simpler option that can be applied if you know your application and users well.
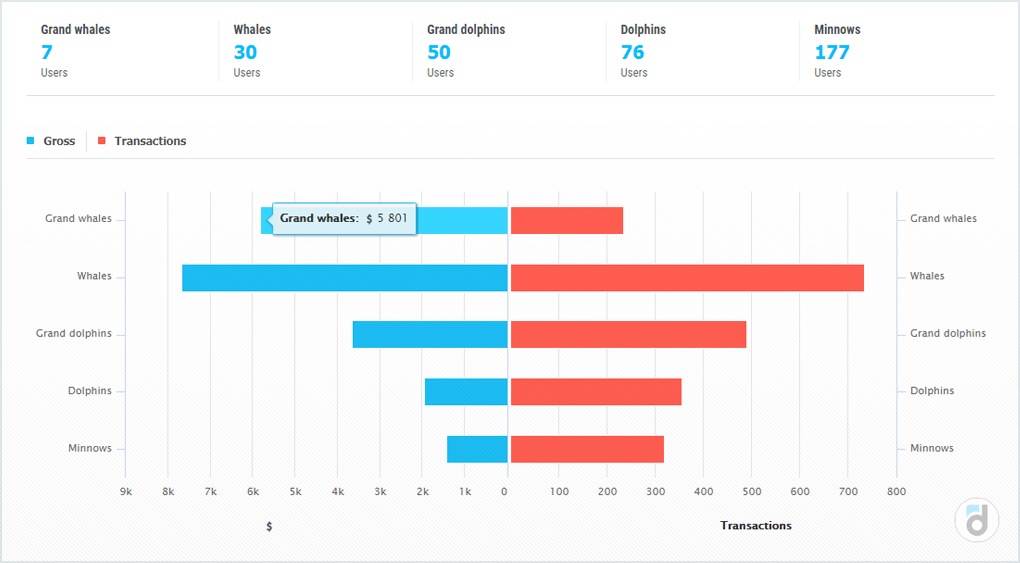
As mentioned earlier, users of different segments often behave differently in the application. For example, the retention of whales is usually higher than that of other segments, but they take longer from the moment of installation to making a payment. However, this is the segment that usually generates most of the revenue. Therefore, it is important to have whales in the product and try to keep them active so that they do not leave the project. In order for whales to appear in the application, you need to create conditions for this, for example, some unique, valuable and expensive content for those who are willing to pay large sums of money.
Segmentation by number of payments
The second option of segmentation of the paying audience is by the number of payments made. It is more important to divide into those who made one payment and those who made repeated payments, because the second ones bring a stable income.
This is how you can consider the audience in terms of payments being made:
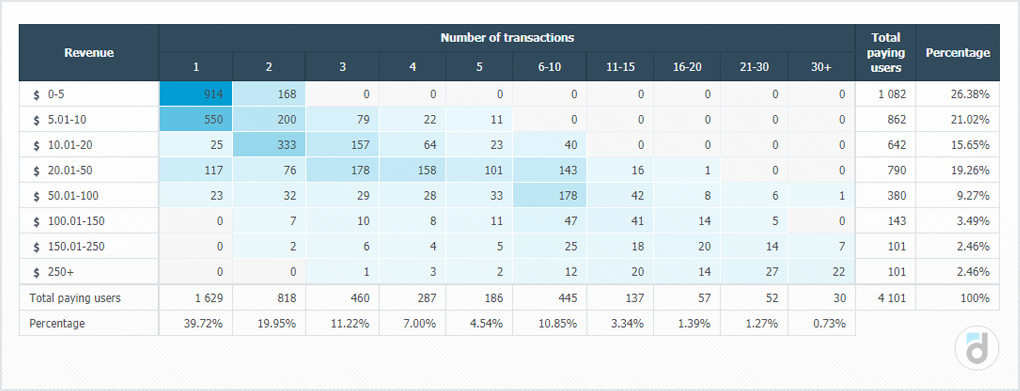
However, it is desirable that users concentrate in the lower right corner, which will mean a large number of payments for large amounts.
Segmentation by time of payment
The behavior of users also differs in the time when they make their first payment. Knowing how the majority acts, you can plan actions for an audience that behaved differently.
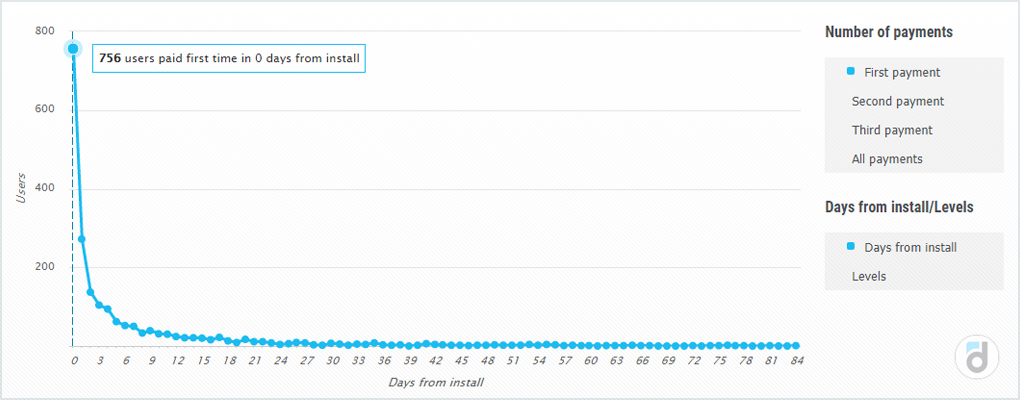
For example, if most users start paying on the first day after installing the application, then those who have not done so can be additionally motivated to make a payment from their 2nd day in the product.
We emphasize that segmentation by time of payment considers new users (and mainly the first payments) and speaks about the speed of their conversion.
A report on this parameter may indicate that, for example, new users convert mainly on their first day in the product.
Segmentation by time since installation
This segmentation describes the structure of income, answers the question of which users bring most of it.
A report on this parameter, for example, can give information that newcomers make up 2% of income, and the bulk of it is generated by those who installed the application 6 months ago.
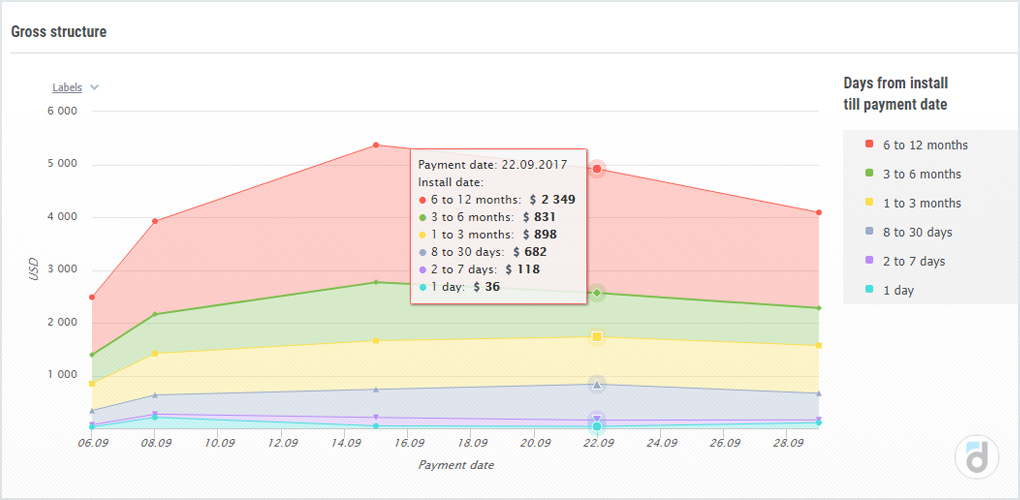
That is, such a report allows you to understand which users bring the greatest income in the project, as well as due to which segment there is an increase or decrease in income.
This can be useful when planning various changes and experiments for a specific audience segment, as well as when evaluating a new release.: how exactly did it affect a particular segment of users. For example, it may happen that after the release, new users who have not seen the application before will continue to pay, and those who have been in the product for a long time will remain dissatisfied with the changes and this will negatively affect the revenue from this segment.
***
Despite the fact that users who pay and pay a lot are the most valuable for the product, it is important to have all user segments in the game, because together they create a common ecosystem, without which the existence of the project as a product is impossible.

Read also materials about other metrics: