Lifetime is the metric that clearly shows the interest of users in the product. How to work with it, – says devtodev analyst Vera Karpova in our series of materials “Performance indicators of games”.
The publication is published as part of a series of materials about game metrics from App2Top.ru and devtodev. Articles are divided by seasons, each of which is dedicated to a specific topic. The second season is called “Users”. In it, we talk about those business metrics that reflect the effectiveness of the application in terms of working with the audience.

Vera Karpova
Sometimes (usually on New Year’s Eve or on one of the Mondays)
we decide to start going to the gym, buy season tickets and start training hard.
Someone needs one lesson to forget about this idea after a week of muscle pain, someone honestly goes for one month to work out the purchased pass, and someone gets involved and spends evenings in the gym for several years.
The situation with applications is absolutely identical – not all users have been using it for years, most stop using it as soon as interest or need disappears.
And this is an indicator of the demand and interest of users, as well as a guarantee of their financial activity.
There is a metric that characterizes this process and shows how long the average user is active in the project – Lifetime (or LT). Moreover, activity here means not his daily visits, but the amount of time that has passed between the first and last launch of the application.
Usually Lifetime is calculated for cohorts and the more time passes from the moment of installation, the fewer users from this cohort continue to use the product. The greatest outflow occurs, as a rule, in the first days. It looks like this and is a graph of the Retention metric:

There are several options for calculating Lifetime. Perhaps the most accurate is to take a cohort of users, wait until all of them stop logging into the project and calculate how much on average users spend in the project.
For example, there are 100 users in the cohort. We know how many days they spent in the project before they left:
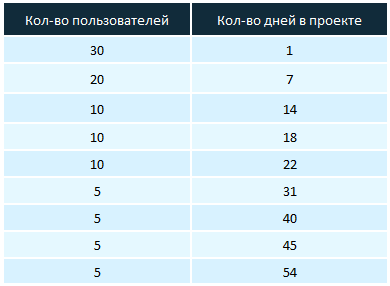
In this case, their Lifetime will be 15.6 days.
But in practice, this method is not applicable, since it will take quite a long time to wait and it is not always possible to draw a conclusion from one cohort.
Therefore, Lifetime is usually not considered, but rather evaluated, taking into account any third-party information, in particular Retention.
One way to do this is to consider those users who have not logged into the application for 7, 14, 30 or more days to have fallen off. In other words, to determine the criterion of “non-return” of users. Usually this period is 1-2 weeks of inactivity.
It is this method that is used in devtodev, and the dump period is 7 days.

Another, slightly more complicated way is to calculate the integral of the Retention function (since Lifetime is the area under the Retention curve), or simply add up all the Retention indicators. To do this, you need to know the Retention values for several days. It is desirable that the number of days be as large as possible, since the accuracy of the calculated Lifetime will depend on it.
For example, we have Retention values for the first 28 days. Adding them together, we get the Lifetime value, which is 5.05.

It should be borne in mind that Lifetime is an average value, because it does not mean that most users leave the project after this number of days.
This is the benefit of this metric – it shows the overall situation of the product in one digit.
Let’s say that during the experiments it turned out to increase the Retention of the first days, but at the same time the metric began to fall, starting from the fifth day.
Having received such a result, it is quite difficult to assess the effectiveness of changes – which of the Retention has a stronger impact on the project, whether the Retention growth at the beginning is enough to compensate for a longer drop after the fifth day.
While Lifetime can help to make this conclusion, since this indicator takes into account all Retention values. And counting it for this example, we can conclude that the change had a positive impact on the project.
Also, when working with Lifetime, it is worth paying attention to segmentation. Moreover, you can segment in two directions:
- use standard segments, such as country, device;
- or divide users by the time they spend in the application – by Lifetime itself.
In other words, you can separately analyze and evaluate the behavior of users whose Lifetime is less than a week, or from a week to two, from two to a month, and so on.
Probably, the behavior of such segments will be different and by examining it for each group, you can find problem areas in the application and understand the reason for the outflow.
What else is useful for Lifetime?
This indicator indicates how long the user will leave the project. Knowing when this will happen, you can try to change its behavior: offer a discount, send a push notification, change something in the application to extend the user’s stay in the project.
In addition, the Lifetime indicator is closely related to another metric – Lifetime Value, which shows how much money users bring in during their lifetime in the project (Lifetime), so despite the fact that at first glance Lifetime is measured in days and has no financial component, it nevertheless affects income, because the more Lifetime, the longer the user will pay. This is especially important for subscription products, because there each subscribed user will periodically and consistently bring income to the company.
So, the longer the life span of users, the longer and more they will pay.

Read also materials about other metrics: