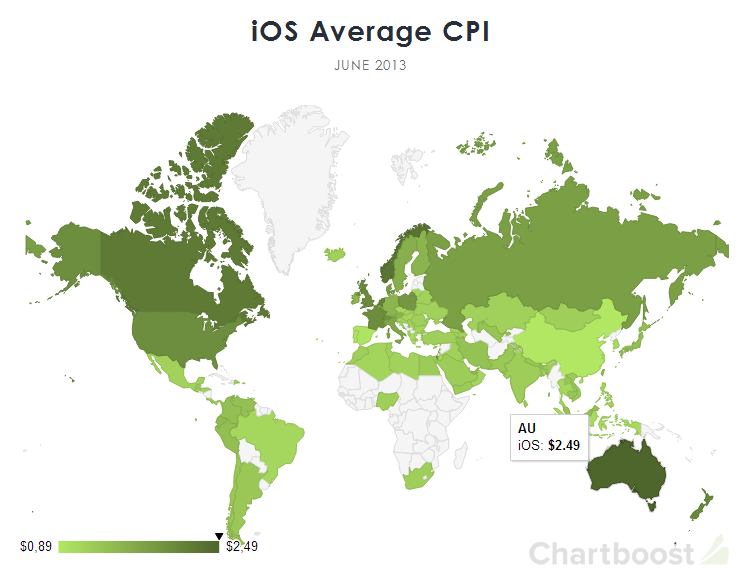
Chartboost has published an interactive global “heatmap” that displays installation prices (CPI) for iOS and Android by country. There you can also find a CPI chart comparing the average cost of applications for iPhone, iPad, iPod touch and Android.

For example, for iOS, the maximum CPI in June was $2.49 in Australia and $2.23 in Canada (popular test launch regions), as well as $2.23 in the US and $2 in the UK. The CPI range for iOS was $0.89 – $2.49.
The average CPI for Android ranged from $0.50 to $1.20, and in the Netherlands, Sweden, Canada, Australia and Singapore reached over $2.00.
Source: www.pocketgamer.biz
