At the end of November, AppsFlyer presented a report on the state of the mobile advertising market in games. We have prepared a squeeze on this document.
Downloads
- the share of non-organic downloads among games is the highest for hyper-casual projects. It means that among all hyper-casual games, the share of inorganic downloads reaches 63%;
- for the most trending and cash projects, the share of inorganic traffic, as a rule, exceeds organic;
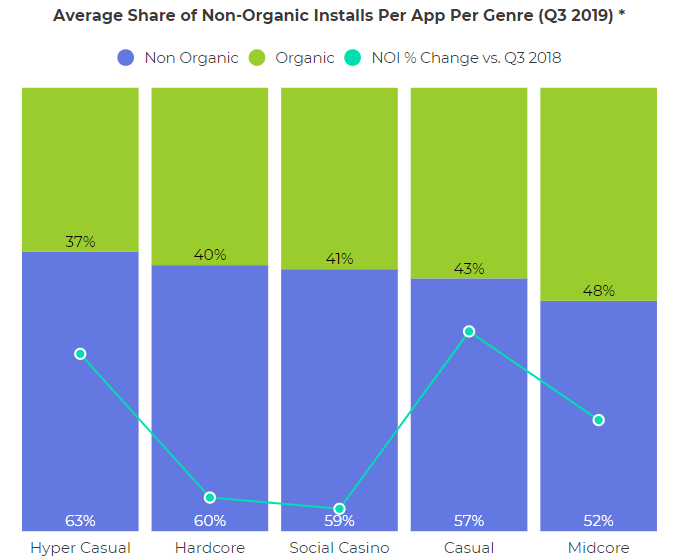
Average share of non-organic downloads by genre (3rd quarter of 2019)AppsFlyer mentions a rule: the larger the distribution of the game, the greater the share of non-organic traffic.
- This rule is especially relevant for casual and midcore games (the share of inorganic traffic in heavy applications of these genres reaches 75%);
- In terms of the average number of app installs, hyper-casual games are leading in half of the top markets, including the USA, most of Europe and Latin America.
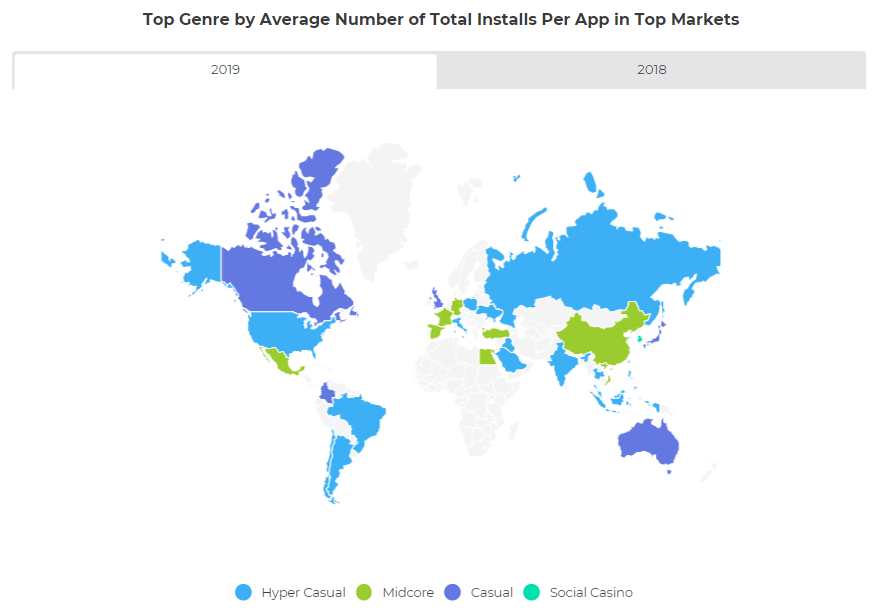
Top genres by average number of total installs per app in top markets Russia and Brazil are among the leaders in the annual growth of inorganic traffic.
- They are present in the top 4 out of 5 destinations. For example, Russia ranks third in the growth of inorganic installations in the genre of hyper-casual games (growth of 156%) and in the first place in the growth of non-organic downloads in the genre of casual games (an increase of 226%).
Involvement
- the highest average DAU per application is for hyper-casual games (slightly more than 400 thousand), the lowest is for hardcore projects (about 100 thousand);
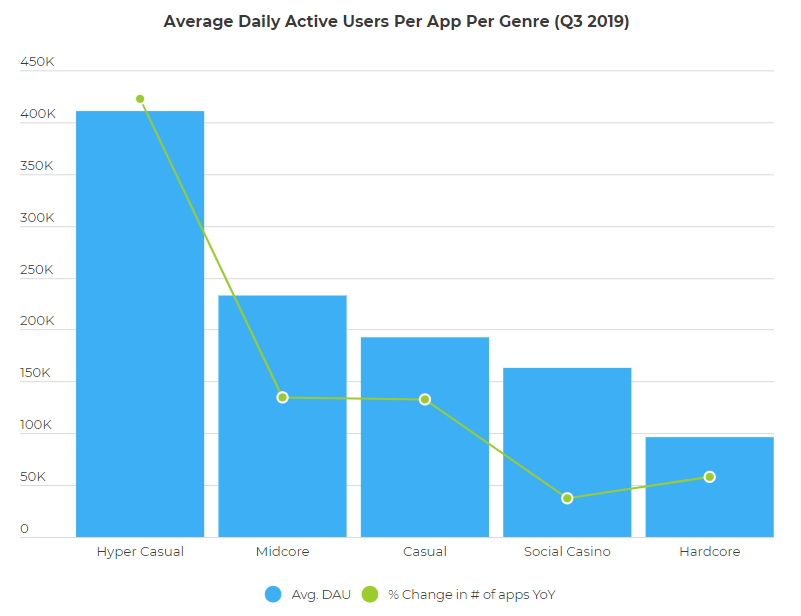
Average DAU for each application in the genre (3rd quarter, 2019) at the same time, hyper-casual games also showed the most significant annual drop in the average DAU per game in the genre (minus 58%), but it is important to keep in mind: the number of hyper-casual games in 2019 increased by 169% compared to the same year earlier;
- the difference between market averages and peak values is often more than a dozen times. For example, if the average DAU per application among hyper-casuals is about 400 thousand, then the average DAU per application among 10% of the top DAU hyper-casuals is at the level of 13 million (32 is a short difference);
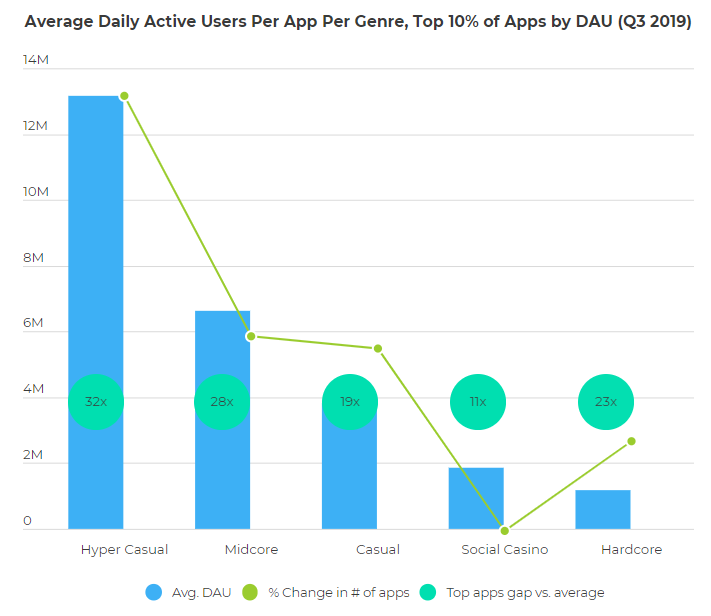
Average DAU for each application in the genre (among 10% of the top DAU applications, 3rd quarter of 2019) stickiness (the ratio of DAU to MAU, showing how often the user launches the game) is growing from year to year.
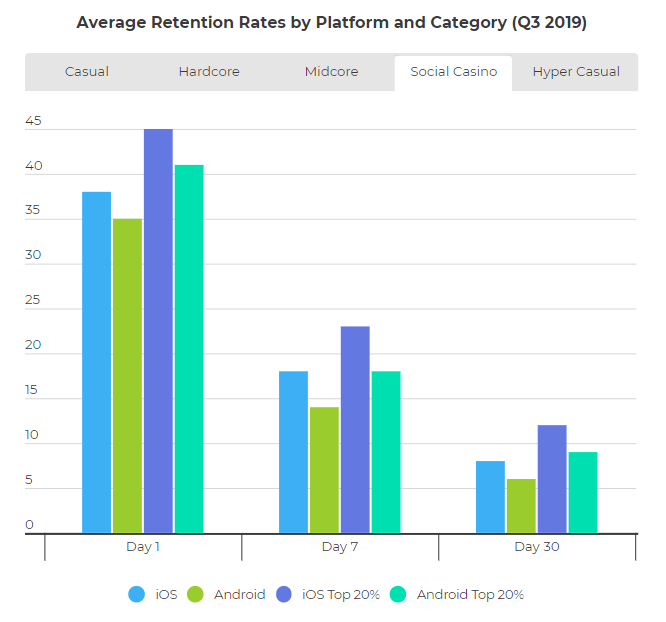
- The highest level (6.3) is shown by projects in the genre of social casino. In hyper-casual games, it is at the level of 4.1;
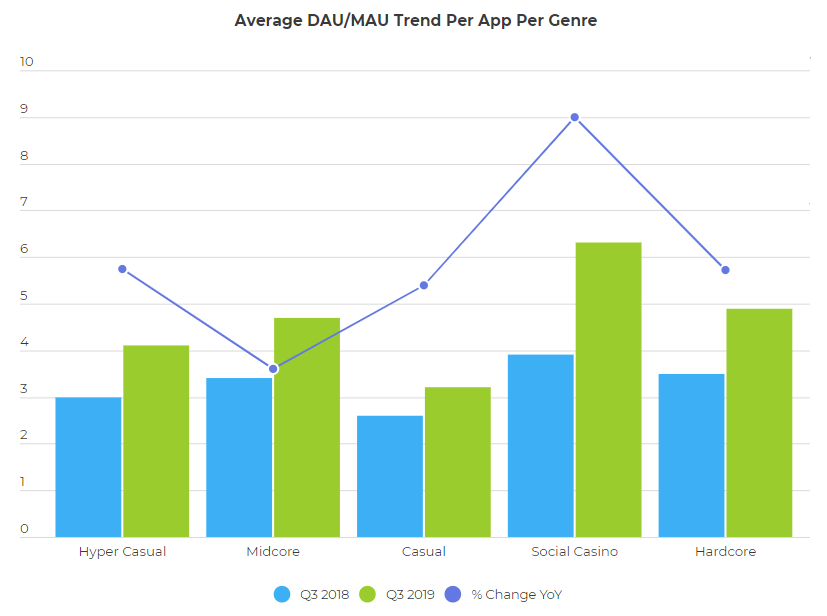
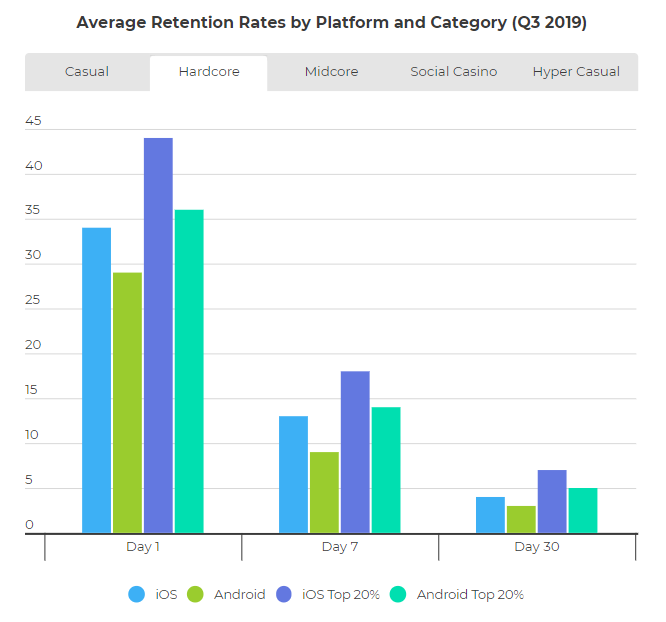
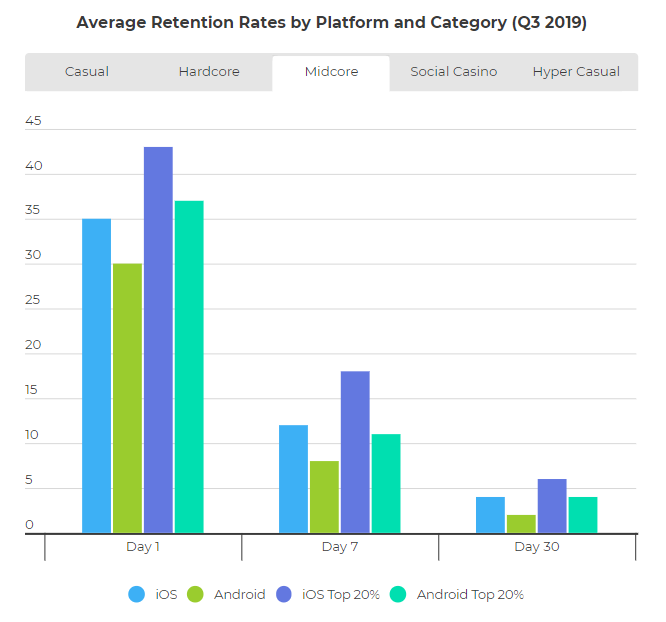
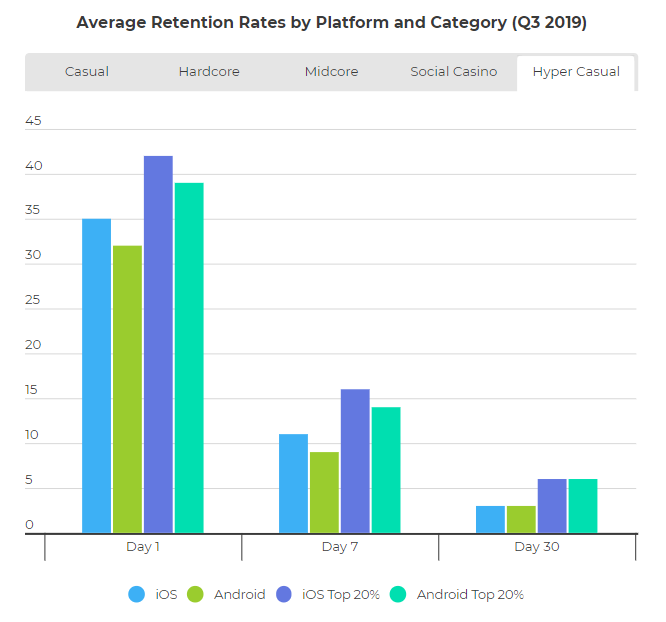
Dynamics of the average DAU/MAU for each application by genrein all genres, higher retention is shown by games for iOS.
- Android programs are lagging by several percent everywhere;
- the retention rate of top games is usually 60% higher than the market average if we are talking about holding 7 days, and 100% higher if we are talking about holding 30 days;
- on average, the highest retention level in the market is shown by games in the social casino genre, whose retention on the first day among the top 20% of representatives of the genre on iOS reaches 45%;
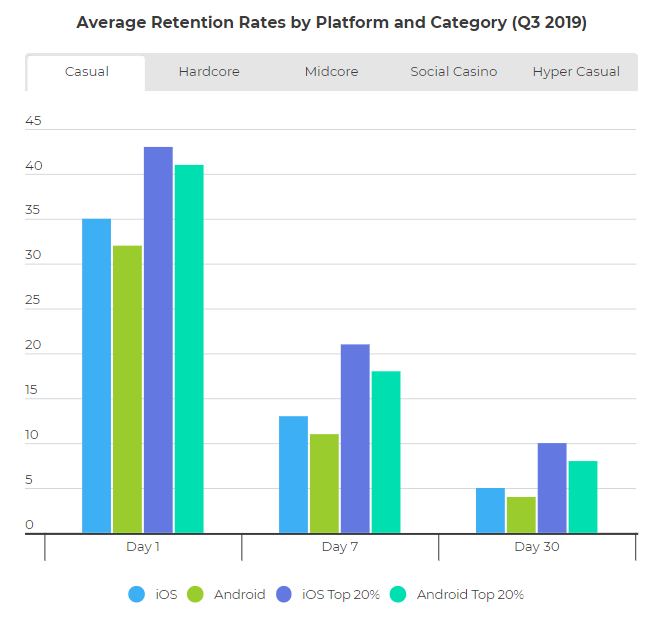
Average retention by platforms at casualAverage retention across platforms for hardcore games
Average retention by platform for midcore games
Average retention by social casino platforms
Average retention by platform for hyper-casual games
games have a 34% higher number of deletions than non-gaming applications (here and further we are talking about deletions in the first 30 days from the moment of installation);
- on Android, the number of deletions is 125% higher, on iOS;
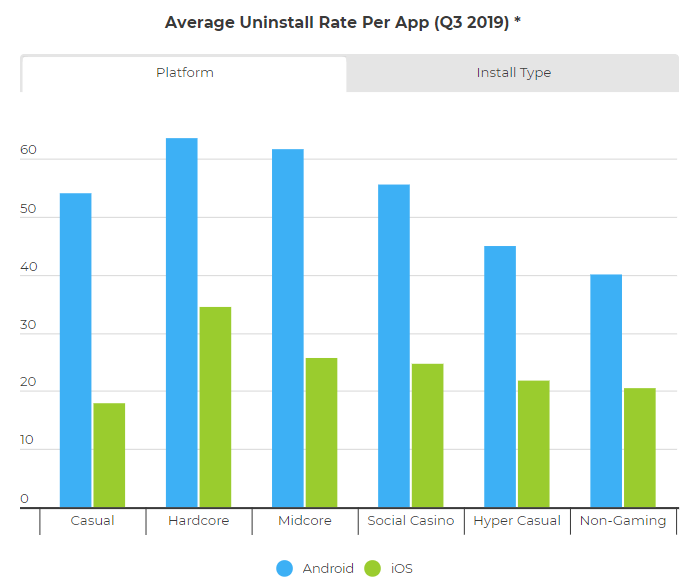
Average level of deletions per application by platform (3rd quarter of 2019)the difference in the number of deletions between games downloaded organically and downloaded as part of an advertising campaign is on average only 14%;
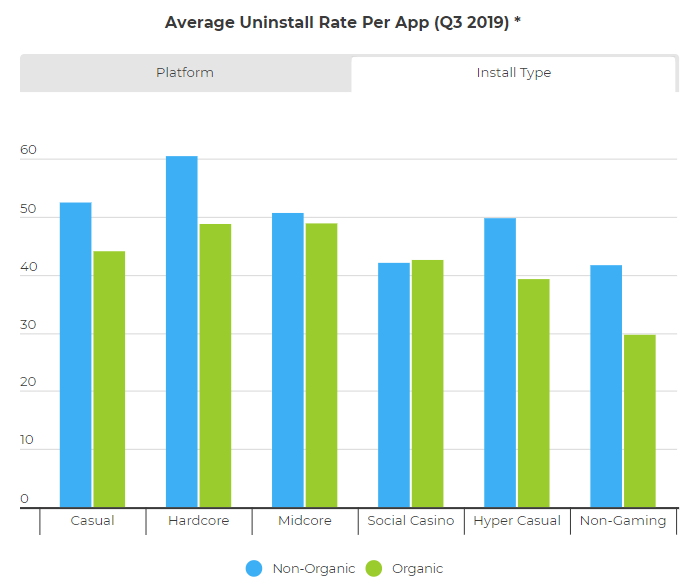
Average level of deletions per application by type of traffic (3rd quarter of 2019)Revenue
- the total number of paying users in hardcore and midcore games is decreasing. In midcore titles, this is almost catastrophic. In 2019, it decreased by 46%;
- in casual games and social casinos, the situation is reversed. And there, and there is growth;
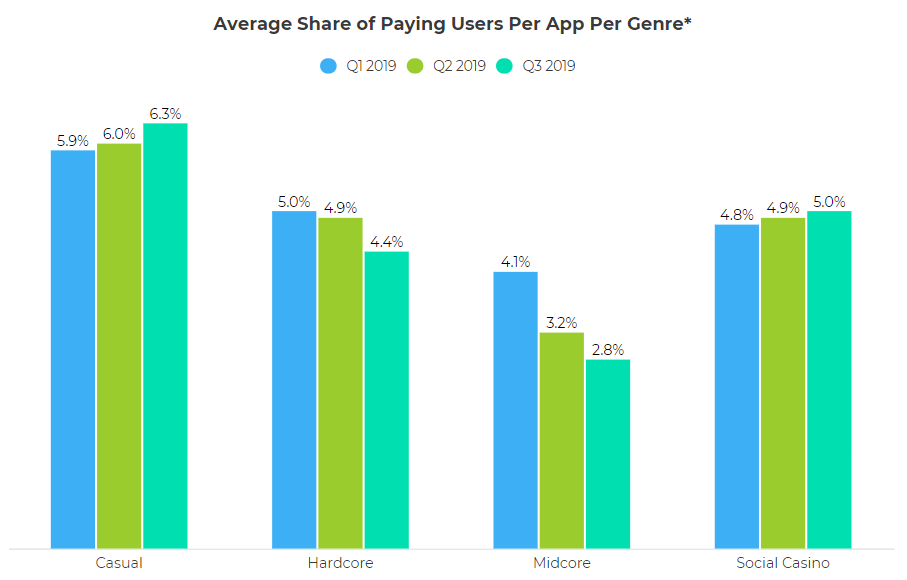
The average share of the paying audience for each application by genre simultaneously with the decline in IAP revenue in hardcore and midcore games, the share of advertising revenue in these genres is growing.
- Over the past year, revenue from advertising in them has grown by 40% and 32%, respectively;
- the share of advertising revenue in casual games, on the contrary, has fallen. This is due to an increase in IAP revenue, not a drop in advertising revenue, which has grown in absolute terms.
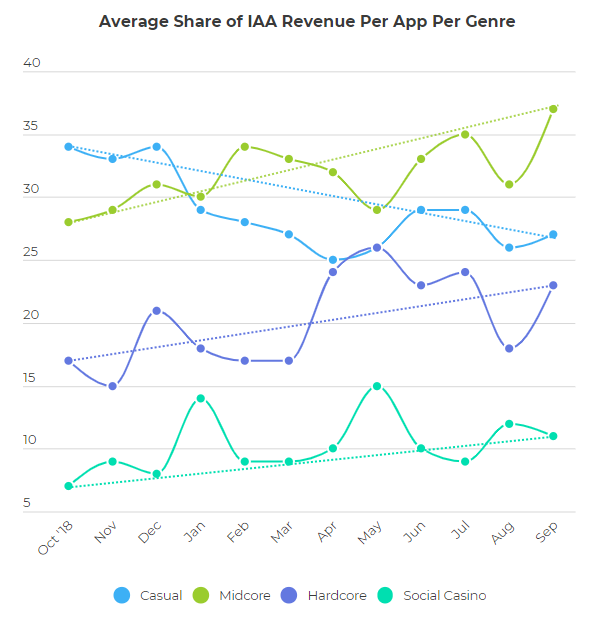
Average share of advertising revenue for each application by genreData source
The data was collected from 29,000 mobile apps that were downloaded 38 billion times by 4.5 billion users, 220 million of whom are paying.
Also on the topic:Google ads generated more Downloads than Facebook Ads for the first time
- In the first quarter of 2018, mobile game developers lost $103 million due to fraud
- ARPPU in casual games and puzzles in the USA – $36.06