The only advertising format whose revenue is steadily growing from year to year is Rewarded Video. This conclusion can be drawn from the Appodeal study on eCPM in mobile applications.
In its work, Appodeal compares the effectiveness of three main advertising formats.
- Rewarded Video (rewarding video) — a video for viewing which the user is given a reward.
- Interstitials (fullscreen ads) — ads that take up the entire screen. It can be a static banner, an interactive picture, a video, or even a game.
- Banners are a picture that occupies part of the screen. It is appreciated by the fact that it can be turned much more often than any other format.
For each of the formats, Appodeal in its research gives eCPM broken down by region, country and platform (iOS and Android). The work is voluminous (54 pages), so we will note only the main points.
Rewarded Video
Dynamics
This is the most profitable format, for a thousand impressions of which you can earn more than $ 12 in the United States on both iOS and Android. And this is the only format from which revenue has only grown in the main countries of the Western world (here and further July 2018 — June 2019 is compared with July 2017 — June 2018).

iOS
Rewarded Video shows particularly strong growth on both platforms in the US market.
Both on the Apple mobile platform and on the Google mobile platform, it was 13%.
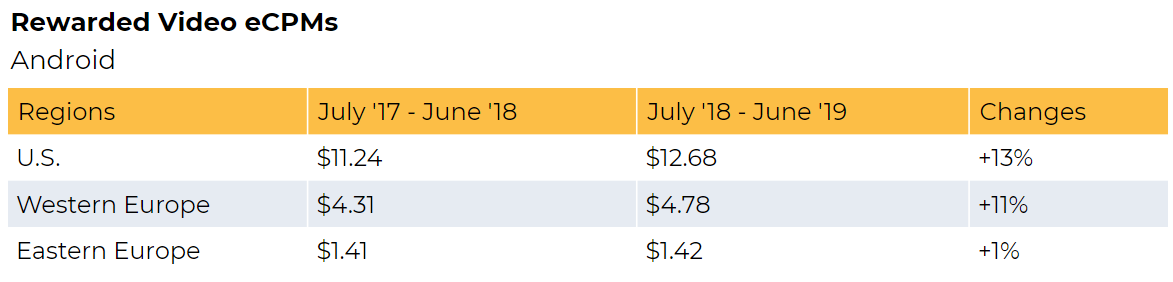
AndroidRegions
In Asia, Rewarded Video has very high rates. Not at the level of American, but very close to them. The same applies to the richest countries in Western Europe.

iOS
The price tags depend significantly on the platform.
On iOS, they are higher. However, the orders are more or less the same.

Android
At the same time, the share of views of Rewarded Video relative to other formats is small.
Depending on the region, this format accounts for from 1% to 4% of views.
Accordingly, the share of revenue in the total advertising revenue of the format is relatively modest — from 12 to 24% (less in the USA, more in Eastern Europe).
Interstitials
Unfortunately, Appodeal does not provide a breakdown by format Interstitials. Below is the average price for all types of full-screen advertising: static, video, and interactive.
Interstitials are not the most common type of advertising. Only 10-15% of all impressions are behind it. However, it accounts for 49-57% of all advertising revenue from mobile.
Dynamics
In the US, iOS revenue is still growing from it. However, in other Western markets, it is either stagnating or falling.
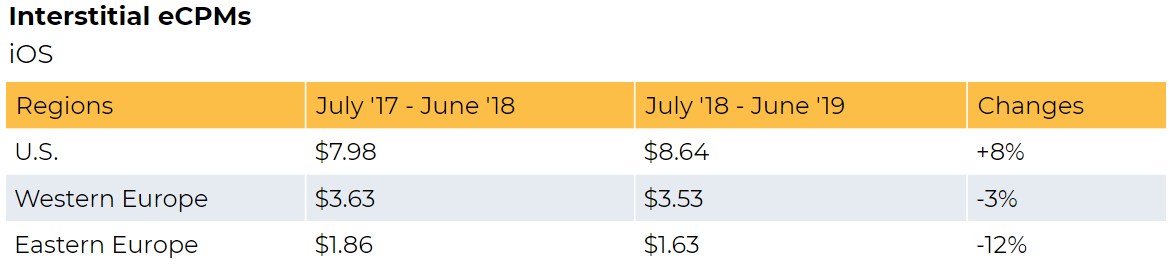
iOS
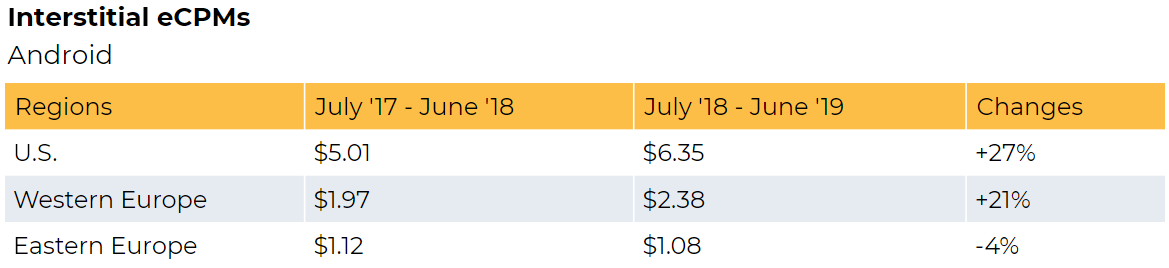
A completely different scenario on Android.
Interstitials here show impressive growth both in the USA and in Western Europe. However, it can easily be explained by the fact that prices here are “catching up” with the iOS level.
AndroidRegions
On iOS, revenue from Interstitials in the USA, Japan and China differs minimally. At the same time, it seems strange that there is also almost no difference from thousands of impressions in South Africa and Singapore.

iOS
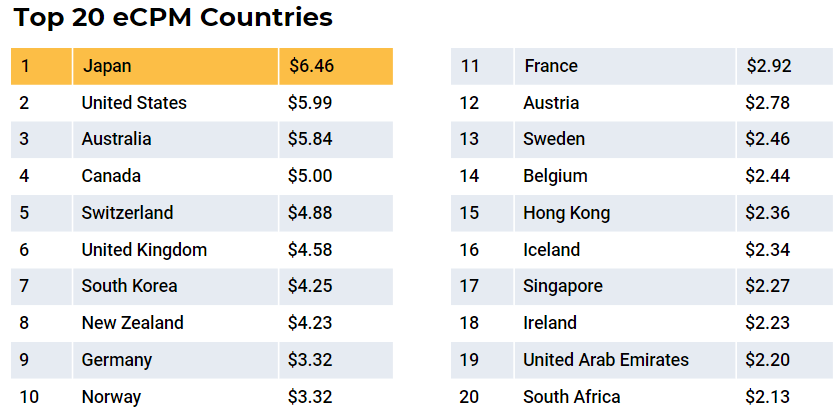
A unique situation with Interstitials on Android.
Only here the payouts from the fullscreen type of advertising in Japan are higher than in the USA. And significantly — by $0.46. At the same time, advertising revenues in South Korea are not even in the top five.
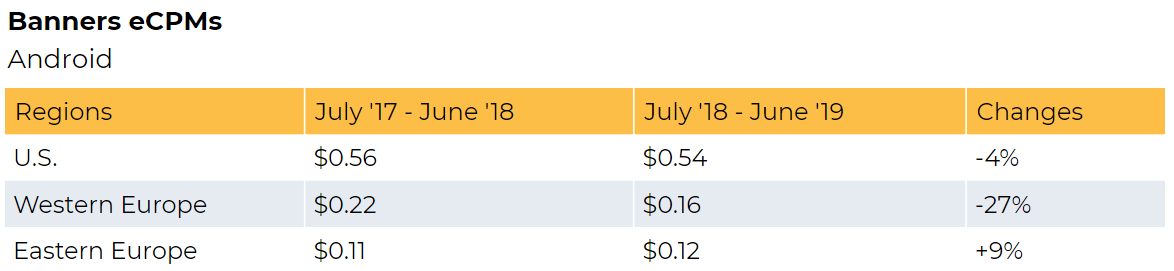
AndroidBanners
This format is considered obsolete. However, it still accounts for 80-90% of all impressions and up to a quarter of all advertising revenue. However, the revenue from it is falling. Given the already low cost per 1000 impressions, this type of advertising is less and less interesting to publishers.
Dynamics
On iOS, growth for the period from the second half of last year to the first half of this year was observed only in the United States. In Western and Eastern Europe, prices were falling and almost equaled at the same level of $0.20.

iOS
On Android, revenue from banners has fallen even in the US.
Although there was a small — at the level of one cent — growth in Eastern Europe.
AndroidRegions
As in previous cases, on iOS, the difference between the first three countries is insignificant, and between the first and twentieth position is twofold. Of note: the absence of China in the top three (it is not even in the top ten according to eCPM). Instead, Australia is in second place.

iOS
On Android, Russia can be seen in the top twenty countries at the highest cost per thousand banner impressions.
Previously, this region was not mentioned in any top research.
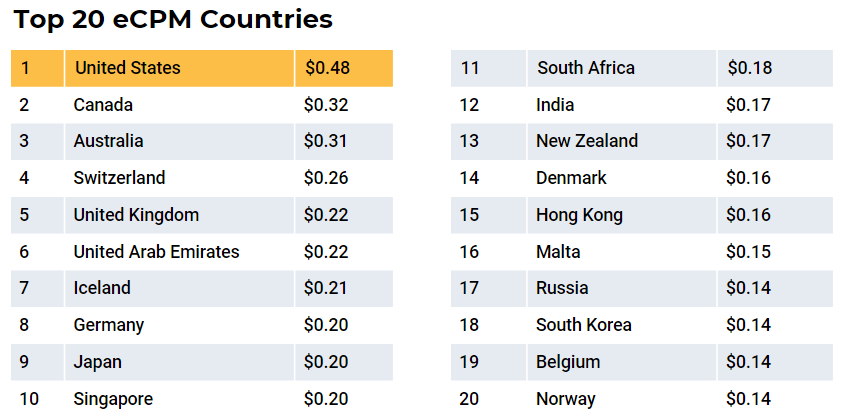
Android
The full version of the study can be found here.
On our own, we note that the work of Appodeal demonstrates well how much the cost and dynamics of advertising revenue are affected by its format, platform and region. At the same time, general trends, as a rule, are natural for the entire market.