The developers of the Adjust analytical platform told about the average retention level, the number of sessions and the number of user actions in the gaming mobile in their latest report.
Retention
The retention rate shows the percentage of users who are still using the app after a certain number of days after installing it. Within the framework of this study, it was considered as follows: the number of unique users who completed at least one session per day, divided by the total number of original downloads and multiplied by one hundred.
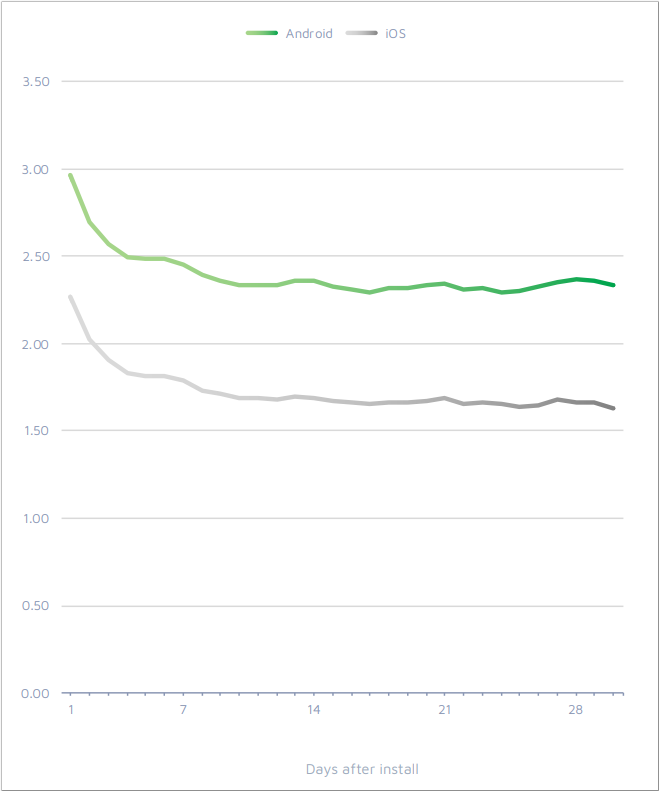
Games on iOS show better retention than on Android
The difference in retention between the platforms, as noted in Adjust, has increased since the last measurement. If earlier Android lag was 1-2%, now it is 2-3%.
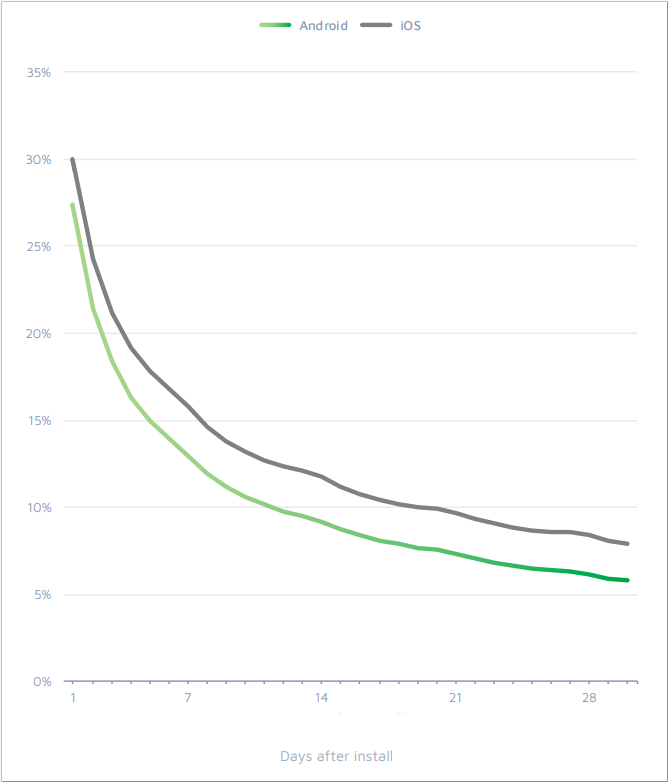
Retention in games (iOS and Android comparison)
Moreover, the situation does not change significantly depending on whether we are talking about organic or paid traffic indicators. In any case, retention rates on iOS will be higher.
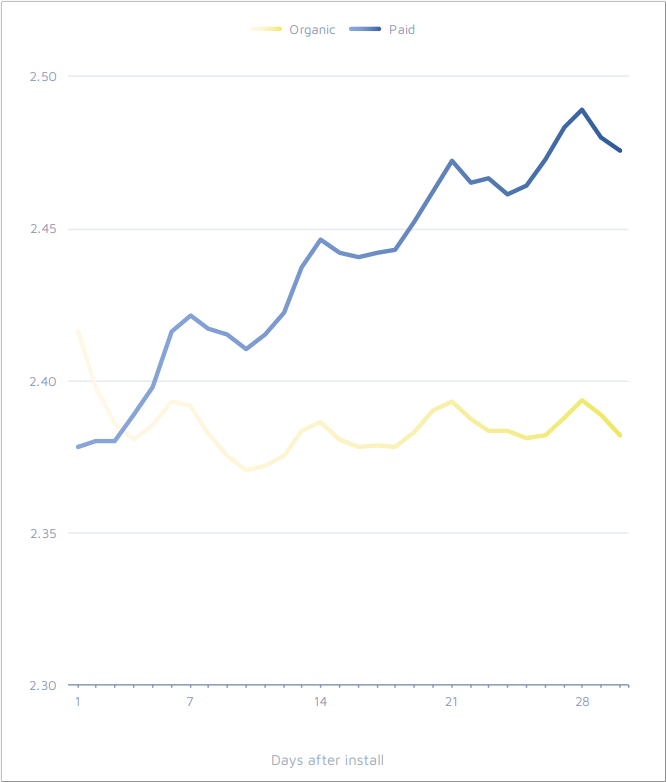
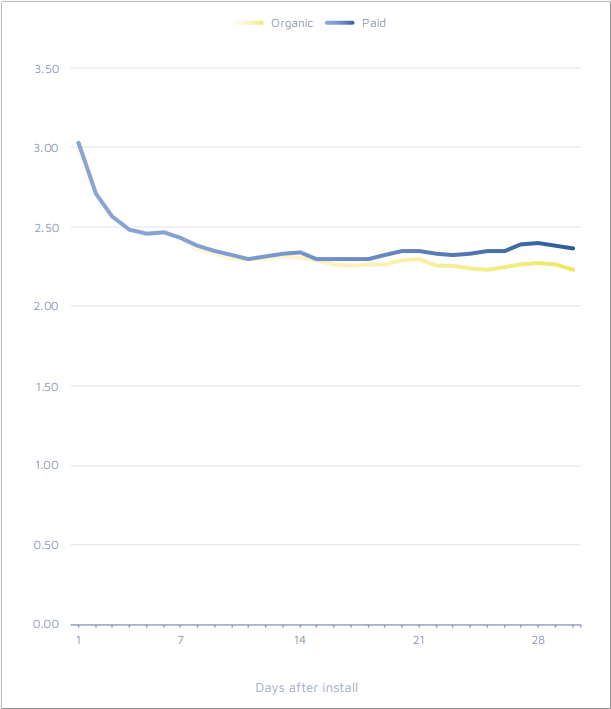
Organics and users attracted for money have almost identical retention
In general, the retention rates of organic and paid users differ little in the mobile games market. Both segments have indicators of the first day — around 30%, indicators of the seventh day — around 12%.
More serious discrepancies begin in the second week and intensify by the end of the month. But they still cannot be called significant.
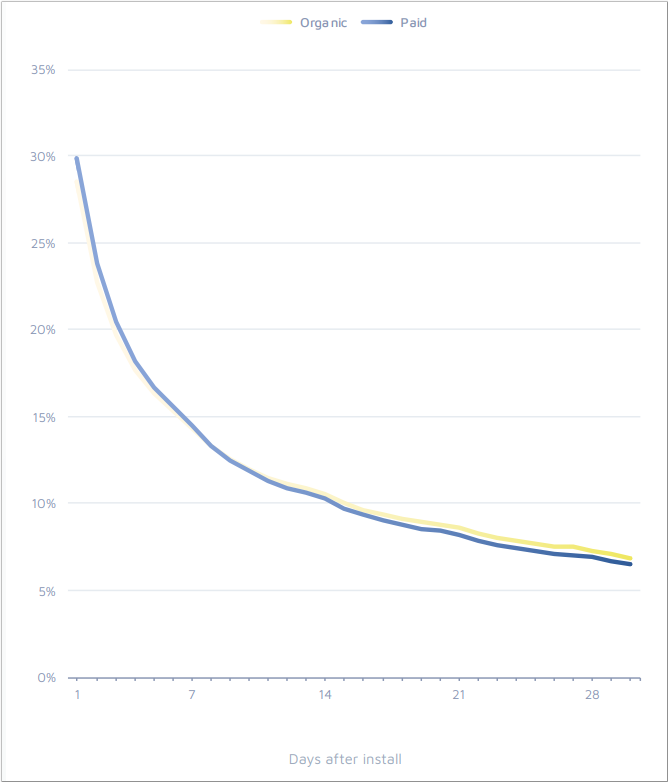
Retention in games (comparison of organic and paid traffic)
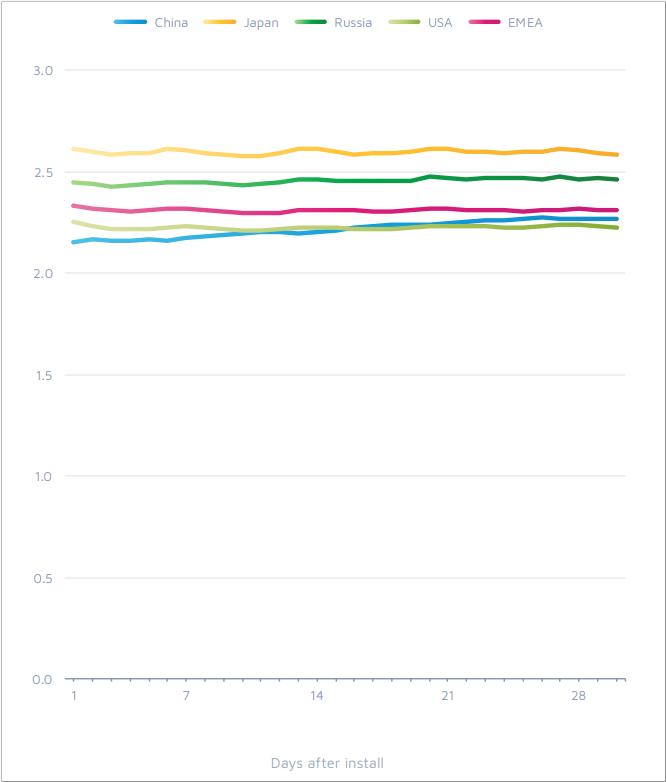
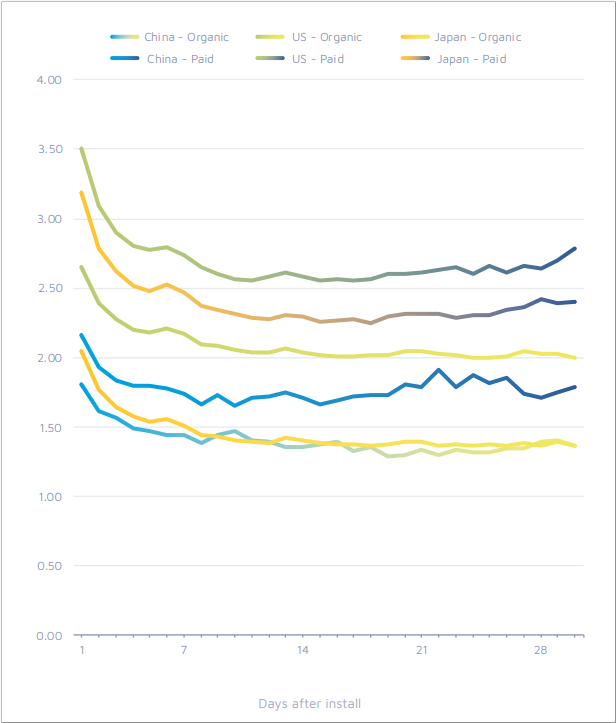
However, it depends on the region. If the situation in Japan or the USA roughly coincides with the one described above, then in China paid downloads show a much higher retention than organic.
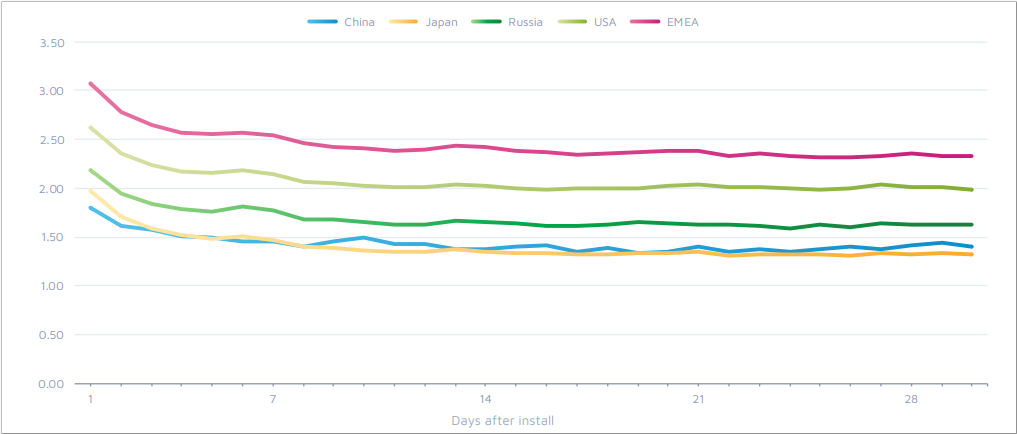
The highest average gaming retention in Japan
Among the regions that Adjust investigated, the highest retention rate in games is in Japan, and the lowest is in China. Their peak discrepancy in the retention of the first day is 13%. By day 30, the discrepancy is reduced to 8%.
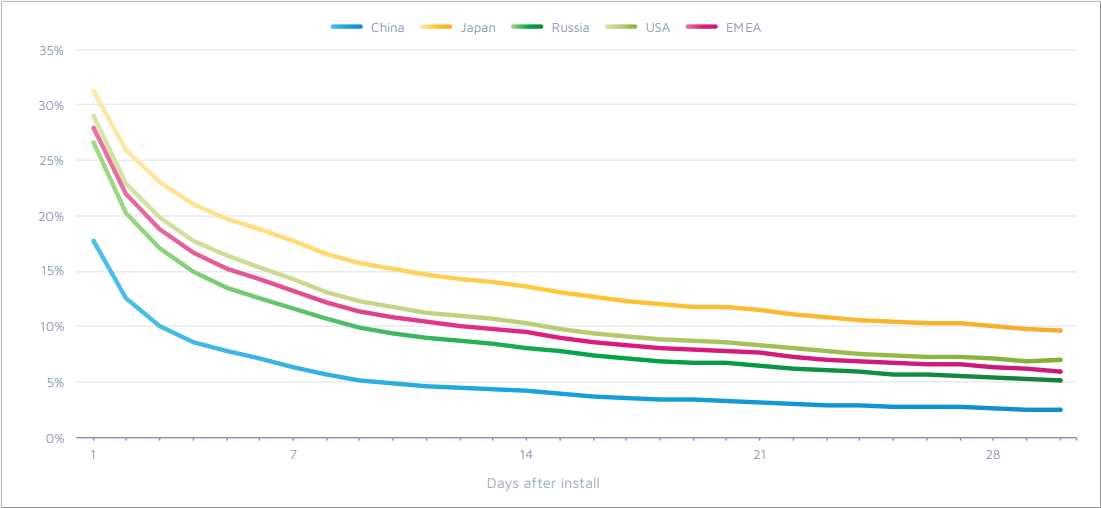
Indicator of average game retention by region
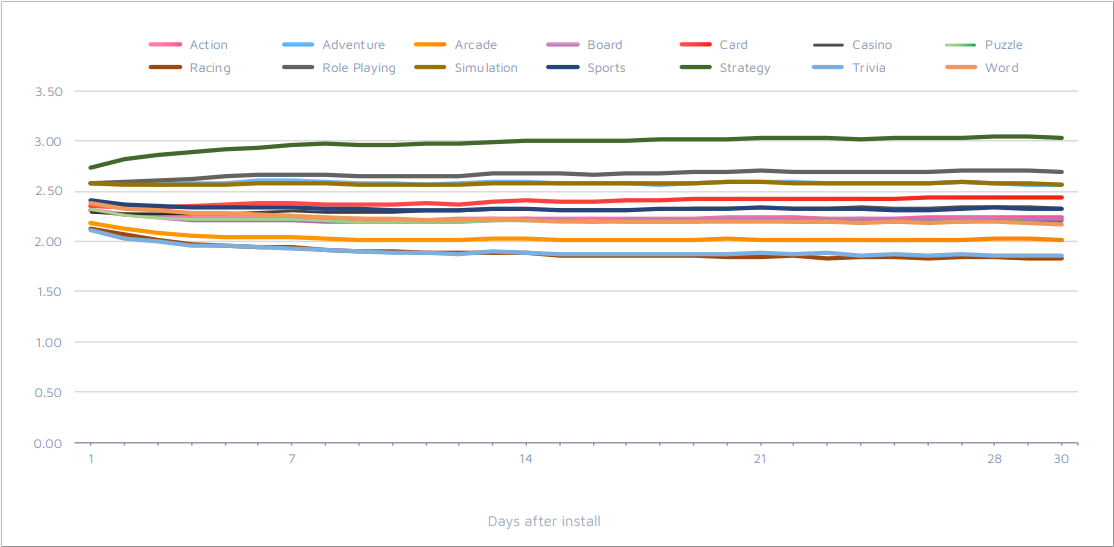
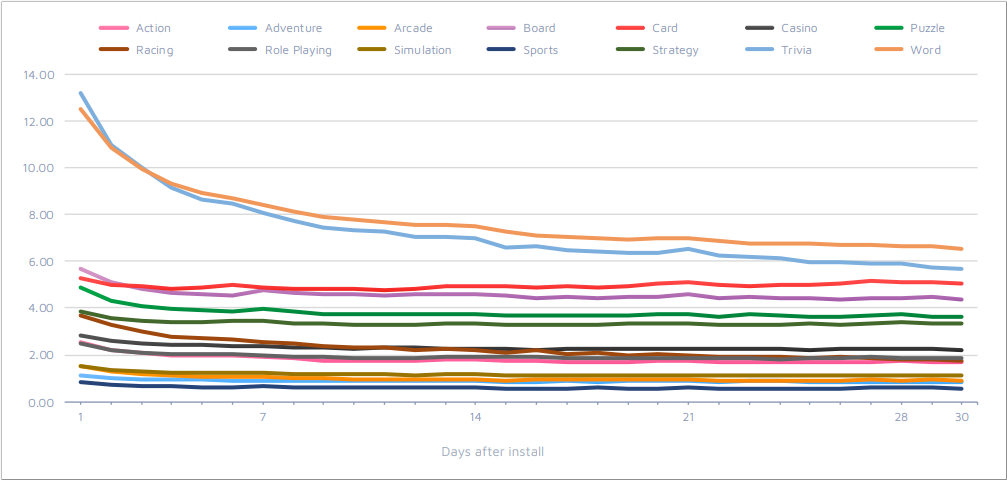
Among the genres, word games have the highest retention of the first day
In the “average hospital”, the best retention on the first day is shown by word games. They have it at 34%. On the thirtieth day, the best metrics show card games. They show a retention of 10%.
Racing has the worst performance here. According to the market, their retention of the first day is around 24%. By day 30, only 3% of players remain in such games.
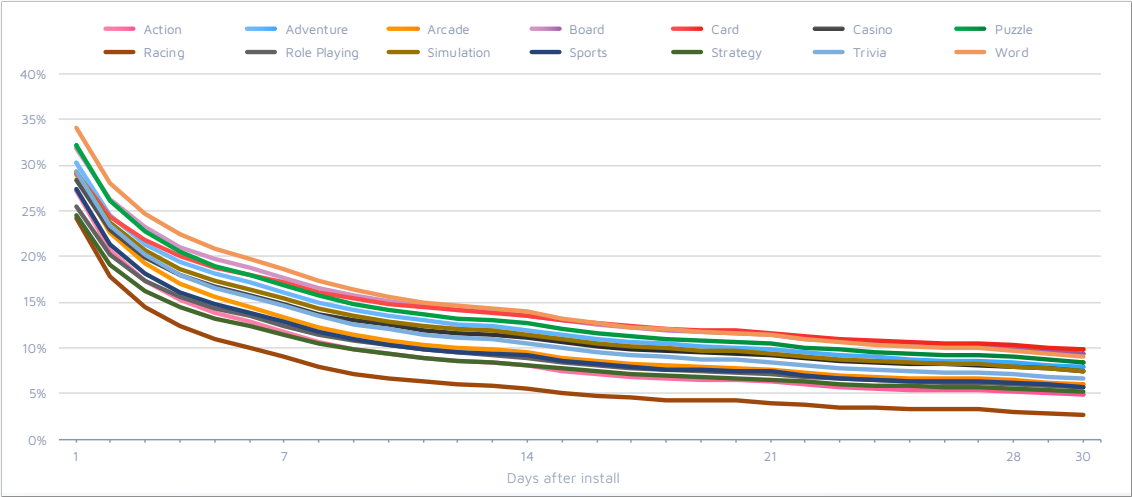
Retention rate by game genre
Number of sessions
Session — the interval of user activity inside the application. Each subsequent session is counted if at least 30 minutes have passed since the previous one. The metric shows how often the user interacts with the application during the day.
Paid users make more sessions in the long run
The number of sessions depends on how the user found the application. In the early days, organic gives more sessions, but over time its number of visits to the game drops. The behavior of attracted users is reversed. On average in the market, they are increasingly entering the game.
Number of daily gaming sessions (organic and paid traffic)
On the graph, activity peaks reflect campaigns to re-engage users in the product.
Players from Japan and Russia make the largest number of gaming sessions per day
The highest involvement is shown by players from Japan. They make an average of 0.5 sessions per day than Americans. Russians also demonstrate high indicators.
Number of daily gaming sessions by country
The smallest number of sessions in the first days after installation is demonstrated by Chinese users. But by the thirtieth day they surpass the American ones.
Strategies have the largest number of sessions
Among all the game genres on mobile, there are the most sessions for strategic projects. This is especially clearly visible on day 30. Also, relative to other genres, role-playing games, adventure games and simulators show good metrics.
The role of laggards here are quizzes and races again. On the thirtieth day, they may have less than two sessions per day.
Number of daily sessions by game genre
Actions
Actions reflect actions taken by users in the application. This can be completing a level, making a purchase, or even clicking on an icon.
In this case, the actions were counted as follows: the total number of actions performed per day for the total number of users retained on that day.
Android users are much more active in games than iOS users
The biggest difference between the sites is in user activity. On Android, players are much more cheerful. They perform more actions per day than players on iOS. This is true both for the first days of the game and for the results of the first month.
Number of actions in games by platform
Paid players perform more actions in games than organic ones
Adjust specialists insist that users attracted by advertising demonstrate the best results in all indicators. The number of actions is no exception. And if there is no difference in activity between organic and acquired traffic in the first days, then after day 14, attracted users begin to show consistently higher results.
Number of actions in games (comparison of organic and purchased traffic)
In terms of the number of game actions, EMEA residents overtake the Japanese and Chinese
How users interact with the game greatly depends on the region. In the case of game actions, EMEA residents are the leaders (here only residents of France, Germany, Turkey and the UK are taken into account). Japan, which is ahead of other regions in terms of the number of sessions and retention, is in last place.
Number of actions in games by region
However, the situation here strongly depends on whether we are talking about organic or purchased traffic. American paid players show a very high number of actions. The same applies to purchased Japanese users. Organics, regardless of the country, shows poor results.
Number of actions in games by region and type of traffic
The greatest number of actions players perform in word games and quizzes
Word games and quizzes have the steepest curves. This means that within these genres, the number of actions performed per day strongly depends on which day the user interacts with the project.
Despite a twofold drop in the number of actions, even on day 30, the mentioned genres bypass all others. Card and board games are the closest to them in terms of activity.
The number of actions in games by their genre
The above data was collected from January 1 to March 31, 2018.
Also on the topic:
- Adjust has introduced a free service for analyzing mobile app metrics
- Russian players have the highest retention in the world
- Research: users spend the most time on mobile games
A source: Adjust