Israeli startup SOOMLA has published a report on the situation with IAP in the mobile games market. Its abbreviated version in Russian can be found at App2Top.ru .
To prepare the report, the guys from SOOMLA tracked the behavior of more than 20 million users, 12 million purchases of items made in games, and 650 thousand IAP purchases for real currency from stores using their own SDK built into a number of games.
They categorized the collected data into four topics: basic metrics (what is happening in the market with DAU, ARPDAU and ARPPU), the behavior of paying users, the virtual economy (what users pay for in games) and the distribution of sessions (how popular games are by genre).
Actually, let’s go.
Basic metrics
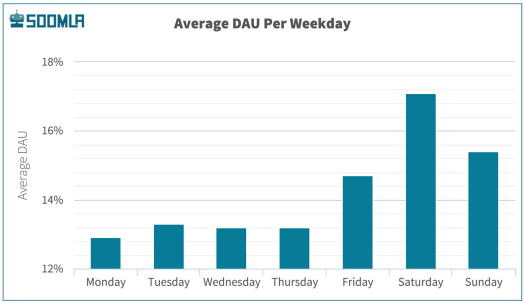
DAU
Users tend to be more active on weekends. Saturday by DAU – leader.
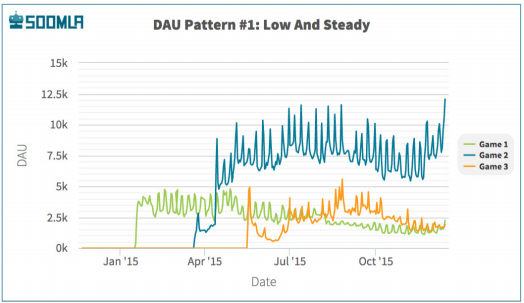
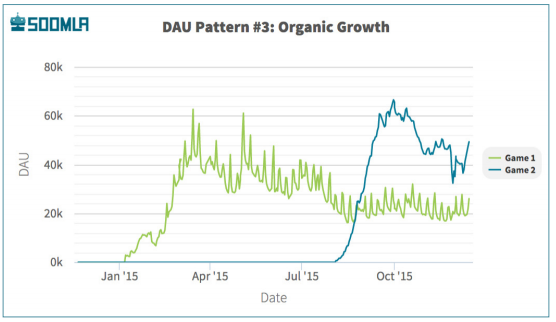
After examining the DAU of games, analysts found three different patterns of game loading behavior at startup:
- The first one is characterized by a slow start, which is ensured by a constant increase in downloads over a long period of time.
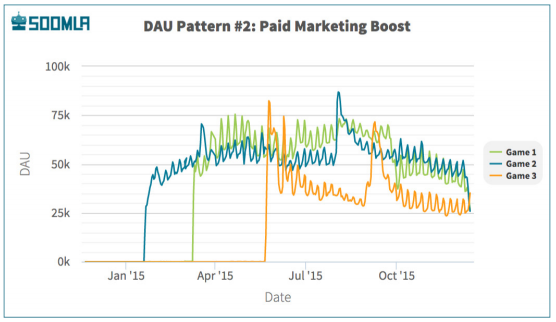
- The second type is characterized by a sharp spike in downloads from the very beginning of their appearance in the store. This is usually due to advertising campaigns, followed by constant fluctuations and a very high average DAU.
- The third pattern is a hybrid model – slow and gradual growth, indicating an organic “acceptance” of the game by users. This pattern is characterized by an average DAU.
ARPPU
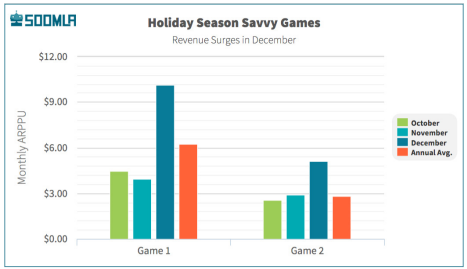
The average income from a paying player, according to SOOMLA, is stable throughout the year until mid-November. But in the Christmas season, the situation is reversed. Christmas is the most profitable period of the year, which gives developers a chance to attract new users and increase revenue.
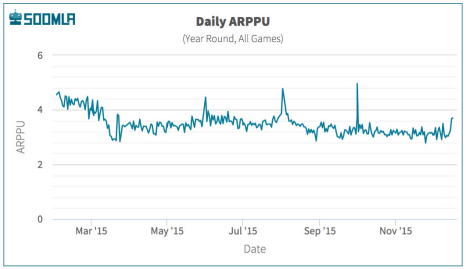
However, most game developers do not use this opportunity. Their projects have an average ARPPU during the Christmas season. But some games manage to do everything right. ARPPU of similar projects can grow in December to 83% of the average for the year.
Since the number of payments themselves does not change very much at Christmas, SOOMLA concludes that the average payment amount increases during this period.
ARPDAU
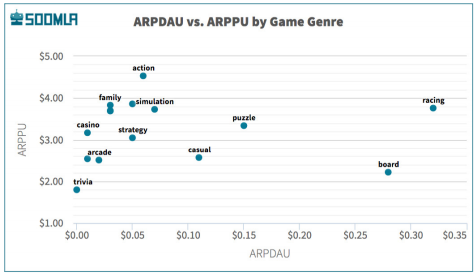
The average income from a daily active user is low – $0.09. But here it is important to understand that it depends on the genre. In board and racing games, it can be $0.28-$0.32. But in adventures, arcades, role-playing and educational games, ARPDAU is less than $0.03.
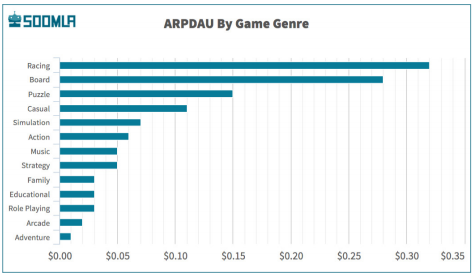
The chart below demonstrates the relationship of ARPPU and ARPDAU for various genres. Most genres are in the upper left corner where ARPPU is high but ARPDAU is low. This means that many active players do not spend at all in games. Board games have relatively low ARPPU, but high ARPDAU, which indicates low prices for items, but a high number of payers among active users.
Behavior of paying players
Here are the most important points that SOOMLA experts discovered while investigating the behavior of paying players:
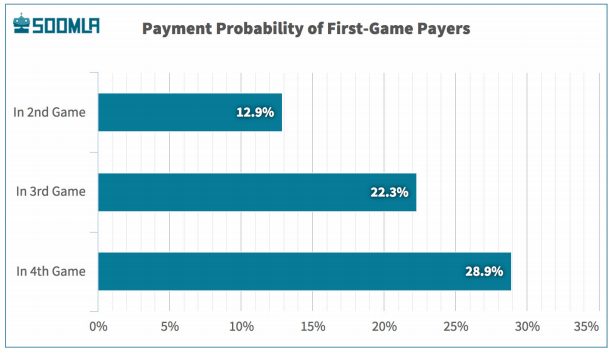
- 13% of the players who paid in one game will also pay in the next.
- 18% of fast payers (those who pay in the first 24 hours after the first launch of the game) will pay in the next game.
- 24% of users who have also started playing the second game within 30 days since the last payment will also pay in the second game.
- 1 out of 3 users who paid in three games will also pay in the fourth.
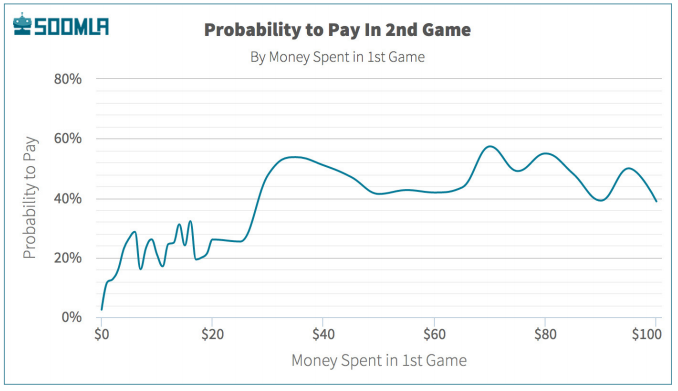
- 40% of those who paid $25 or more in one game will also pay in another game. However, you should not wait for an arithmetic progression.
The dependence of whether the paying player pays in the second game depends on which genre both projects belong to. In the table below, each row represents the possibility of payment in the second game of the genre in the column. For example, the value in the upper left corner of the table (14.3%) shows the probability of a player in an action game to pay in the second game, which also belongs to this genre. Empty cells demonstrate the lack of information received for statistical significance.
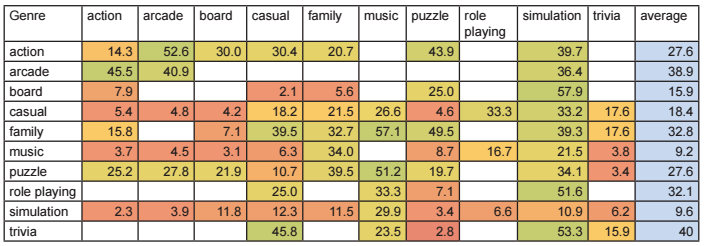
To sum up, players in trivia, arcade, family and role-playing games are most likely to be willing to pay in another game. Those who play simulators or music games are less willing to go for it (but they are still 4 times more likely to pay than casual users).
Virtual Economy
To find out what users buy most often, SOOMLA first decided to figure out what they pay for in games at all.
- Single Use Goods – consumables that can be purchased several times. After use , they disappear
- Good Packs – sets of consumables
- Lifetime Goods – these IAPs are acquired forever. A good example is disabling ads or a new level pack, as well as double coins.
- Equippables are a special type of permanent items that the player uses in the game. These can be characters, cards, clothes, and so on.
- Upgradables – improvements, that is, those items that are used, as a rule, only to upgrade something (for example, to a more powerful engine for a car).
- Currency Packs – sets of game currency
The graph below shows the popularity of purchases of a certain type in games. Market Purchase is direct purchases of a particular thing, Soft Purchase is purchases for in-game currency.
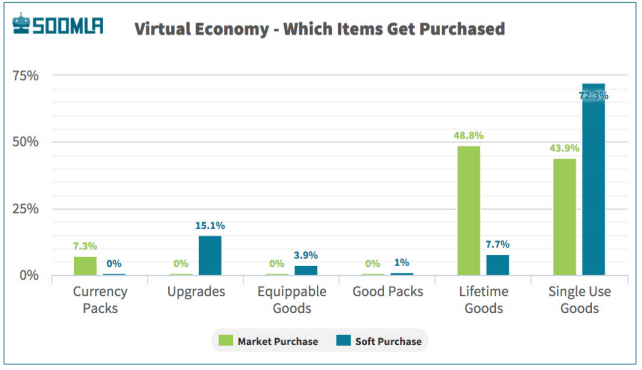
The most interesting thing is that consumables are the most popular. Although they still really like to buy Lifetime Goods directly from the store.
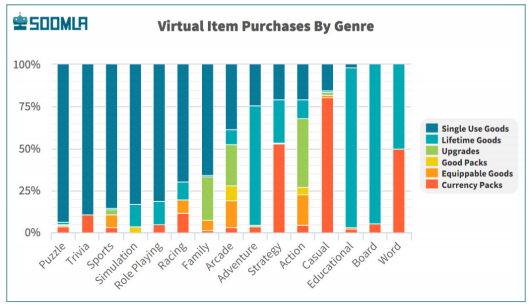
It is clear that the popularity of IAP varies depending on the genre.
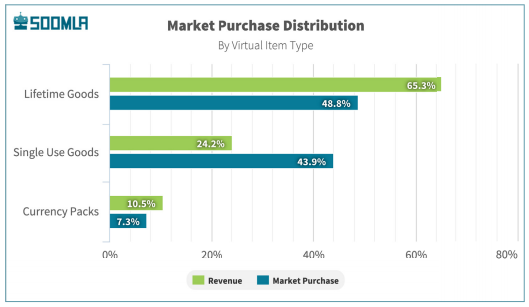
65% of the revenue comes from Lifetime Goods. The average price tag for them is $ 2.6. Despite the high number of sales of Single Use Goods, they are responsible for less than a quarter of revenue, since, as a rule, they cost around $ 1.
Sessions
The results of the study concerning the time spent by users in the game were also interesting:
- The average number of sessions per user is 6.5 (in one game).
- The median number of sessions per user is 2.
- The average session duration is 245 seconds (a little more than 4 minutes).
- Only 6% of users will make more than 20 sessions and less than 0.5% will open the game more than 100 times.
Strategies are the genre with the highest level of involvement. Here, on average, there are 14.5 sessions per user, and the average session length reaches 11 minutes.
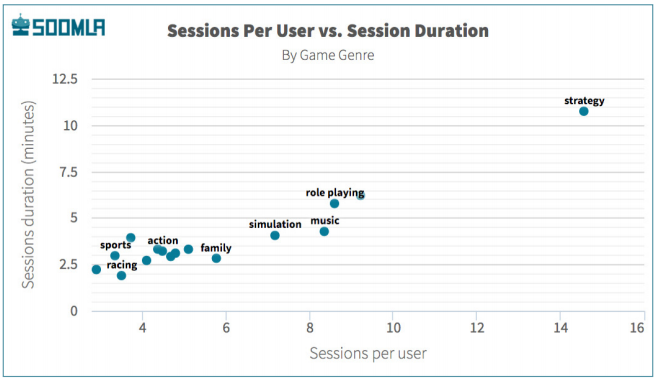
Card and racing games, on the contrary, cannot boast of involvement. Sessions in them last for 2 minutes, on average.
The graph below shows the average number of sessions per user by country.
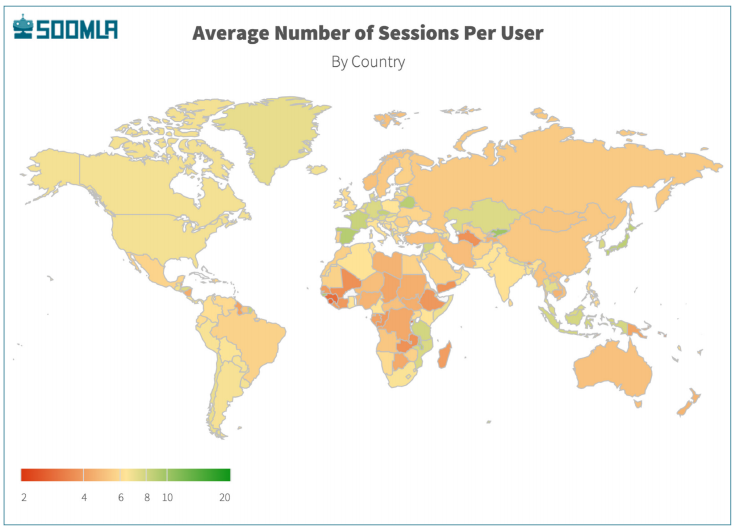
As you can see, Asian countries can boast of a high level of involvement (with the exception of China, Mongolia and Russia, which SOOMLA also attributed to Asia). There are 7 sessions for each player in them. In the Americas, there are 6-6.5 sessions per user. In Europe, the values of the strongest vary from region to region.
Interestingly, Spanish users can boast of long sessions – on average, about 6 minutes. Spain is followed in descending order by Japan, South Korea, Singapore and Russia, whose user sessions range from 5.8 to 5.2 minutes.
The full 29-page version of the study can be downloaded from this link.
Source: SOOMLA