On the Fiksu website there are very interesting graphs with which you can compare the popularity of “apple” devices with each other.
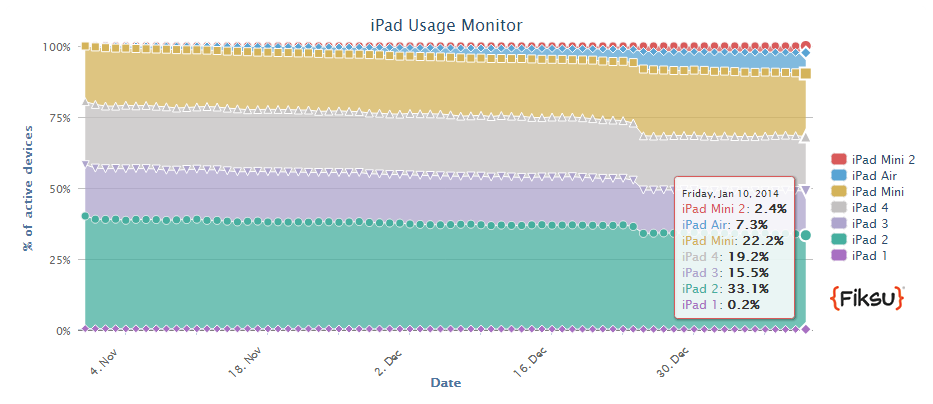
So, according to Fiksu, the iPad 2 is the most popular among Apple’s “tablets”. It accounts for 33.1% of active devices. In second place, the iPad Mini is identical in characteristics (not counting size) (22.2%).
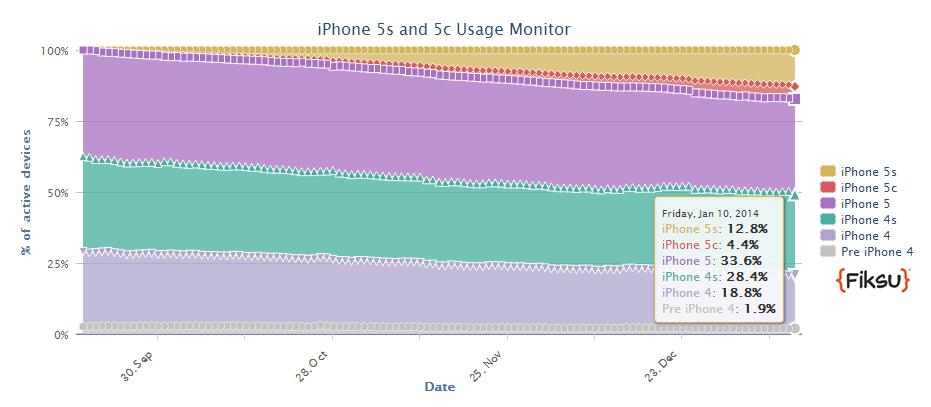
The most popular smartphone of Tim Cook’s company is the iPhone 5 – 33.6%. In second place is the iPhone 4S with 28.4%. Closes the top three iPhone 4 with 18.8%.
What are these graphs for?
The fact is that in the current race for the “most-most” graphics, you can easily forget about the user. Focusing only on the latest versions of gadgets, it is easy to lose a huge part of users who do not want to play a project that is always slowing down, not optimized for older versions of devices.
A source: http://www.fiksu.com/iOS-7-iPhone-5s-5c-Usage-Tracker