How much time players spend on mobile games per week, what is the average ARPPU in Japan and the USA, where players learn about new games, what makes them make purchases – the answers to these and not only questions were given by the research company EEDAR in its voluminous material.
When reading the report, the idea arises that researchers from California have really tried to answer a number of the most pressing questions.
However, it should be noted right away that most (not all) of the material collected by the company was collected not by monitoring user behavior, but by interviewing them.
Actually, let’s go. Let’s start with the basic numbers.
EEDAR counted 1.5 billion mobile players. The total earnings of the mobile games market for 2015 will amount to $25 billion. The mobile games market will account for 30% of the earnings of the entire gaming industry (in 2011 it was 15%).
The largest number of mobile gamers are in China (314.8 million), the USA (136.5 million), Japan (45.8 million) and South Korea (19.3 million). But there is a caveat: EEDAR counted only those players who are over 18 years old.
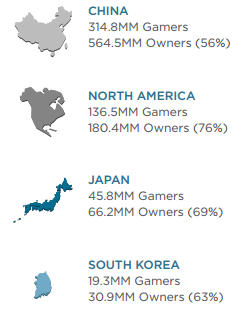
It is curious that the largest share of mobile players in relation to the number of mobile device users is in the USA. There it is 76% (that is, of all mobile device owners in the USA, 76% play mobile games).
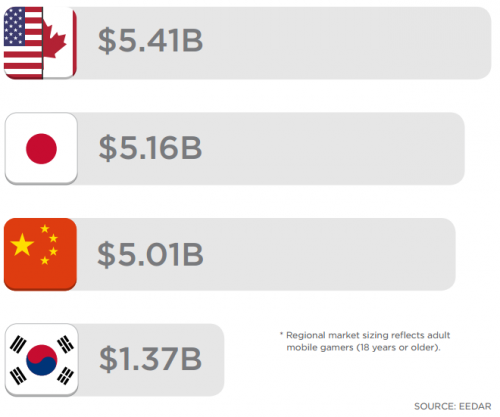
According to EEDAR, the United States is also leading in terms of revenue. This year, the revenue of this mobile market will be $5.4 billion. The Japanese market is slightly behind it, which will earn $ 5.1 billion. The Chinese market, whose revenue will amount to $5 billion, is also not significantly behind.
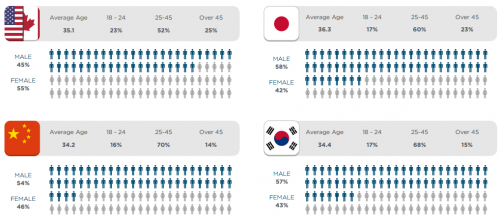
It is also curious: if men prevail among mobile players in Asian countries, then women prevail in the USA: 55% of the total number of players are behind them.
People still play mainly on smartphones. Although in North America there is a large proportion of those who use both devices to play. Be that as it may, the share of those users who use only a tablet to play is very small (China is an exception), so the main mobile gaming device is still a smartphone.
People play on smartphones, mainly in the bedroom or just at home, although in Korea there is a large number of users using a mobile device to play on public transport.

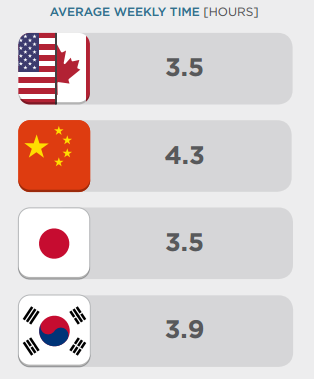
Chinese players spend the most time on mobile games. On average, they can spend about 4.3 hours a week on mobile games. Americans are seriously lagging behind them – 3.5 hours a week.
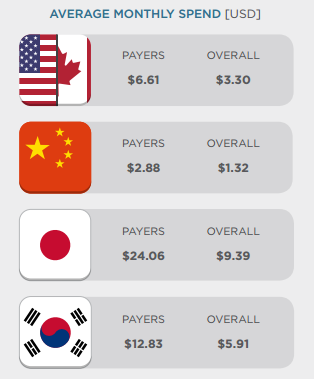
The Japanese have the highest ARPPU/month – $24.06. ARPU/month is also a record – $9.39. Koreans are in second place. Their average ARPPU is $12.83 and ARPU is $5.91.
Out of curiosity, the report contains sources from where players learn about new mobile games. Here the difference between the markets is most clearly traced:
- North Americans learn about new games from friends, either by personal communication, or by seeing someone playing them, or from friends’ posts on social networks.
- The Chinese learn about games from charts, gaming sites and TV ads.
- Koreans also pay attention to feathering.
- In Japan, the main source of knowledge is advertising on TV.
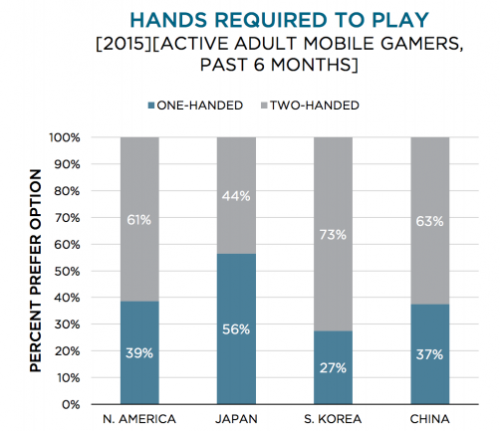
Most mobile gamers play “active games” while holding the device with both hands. The only exception here is Japan, where 56% of gamers still prefer to use one hand.
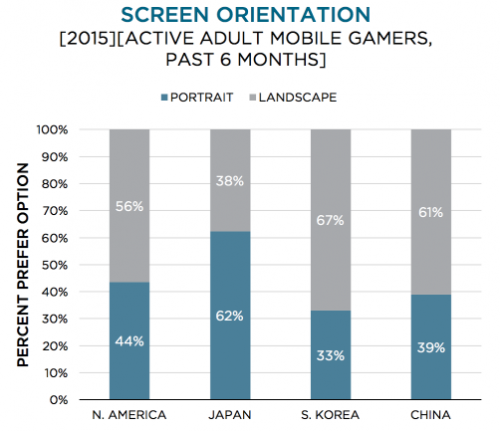
At the same time, active games are mostly played by users holding the device horizontally. The exception is Japan again.
But, of course, the most interesting is the information about what players from different countries spend money on in games.
Americans prefer to spend on “permanent content” (new levels, services) and on resources to accelerate progress. The Chinese are looking at features that accelerate progress (VIP statuses) and cosmetic improvements that are permanent. Koreans are looking at things that also accelerate progress – both permanent (services, things) and temporary (boosts and resources). The Japanese, in turn, are on permanent things and temporarily improving the characteristics of the boost.
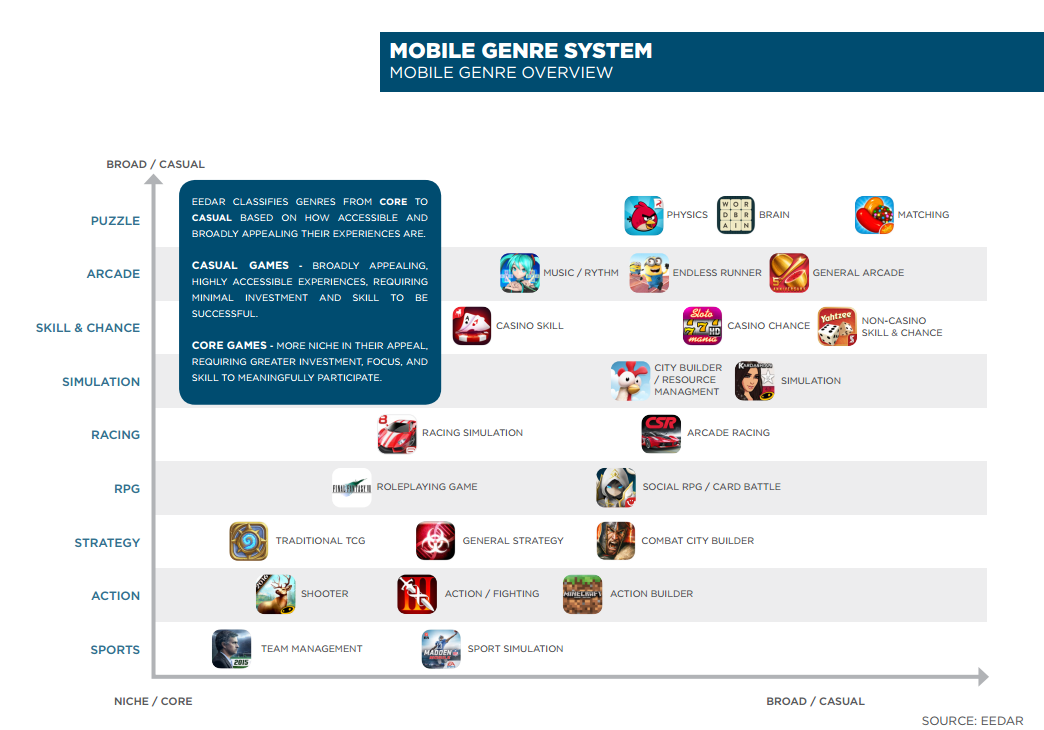
And EEDAR classified genres according to the size/niche of audiences and their casualness/hardcore.
In general, it turned out to be very interesting, the full version of the report can be ordered here. However, as we have already noted, we urge not to take the specific figures presented too seriously, only to general orders, since surveys are far from the most accurate analytical tool.
Source: EEDAR