How to analyze apps that work by subscription? This question is answered in his article Vasily Sabirov, leading analyst of devtodev service.

Following the logic that most applications in stores are monetized using the shareware model, articles on application analytics are mainly devoted to it. However, there are other monetization models that also require high-quality analytics, and that’s why I, Vasily Sabirov, a leading analyst at devtodev, decided to prepare material on how to analyze subscription-based applications.
It will be mainly about SaaS, since it is in this segment that the subscription model prevails.
So, let’s start with the simplest. What metrics should I use to analyze such applications? Basically – the same:
- scale metrics (DAU, MAU, users online),
- traffic metrics (CAC, LTV, ROI),
- retention metrics (retention, lifetime),
- monetization metrics (ARPU, paying share, Revenue).
Let’s take a closer look at some of them.
Traffic metrics
Speaking about the criteria for the effectiveness and viability of subscription-based projects, usually instead of the usual LTV > CAC inequality, which means a simple return on traffic, they talk about inequality:
LTV > 3*CAC
Note: LTV (LifeTime Value) – the amount of money received from one user for the entire time, on average for the project; CAC (Customer Acquisition Cost) – the average cost of attracting one user (no matter what model you buy traffic, CPA, CPC or something else, you can always calculate the average the cost of attracting one user).
Where did this multiplier 3 come from?
This is an expert value that has been formed over the years in the industry. Let it be “average in the hospital”, but experience shows that it is possible to focus on it.
I propose the following interpretation: we pay one CAC directly for the user, another for his retention (servers, technical support, notifications and mailings), the third is already profit. Let it be conditional, but you can remember.
Another criterion for the effectiveness of the project looks equally conditional (but quite functioning).: the payback of traffic should occur within 12 months.
Why exactly 12? And again, this is an expert value that you can use as a benchmark, especially since a year is an excellent planning horizon. If your traffic pays off in 13-14 months, this does not mean that your business is inefficient, but it means that you have a lot to strive for. The faster the traffic costs are recouped, the better.
Retention metrics
Retention of 1, 7, 28 or 30 days is usually used for shareware projects. If the project works by subscription, then the step will not be a day, but, as a rule, a month. Therefore, it makes sense to use retention of 1, 2, 3 months, etc.
However, if the decision to subscribe is preceded by a trial that lasts for several days, then it makes sense to measure retention metrics for each of the days of this trial.
Another recommendation: if your project has the possibility of unlimited free use, then it makes sense to consider retention separately for paying and non-paying users. Actually, in such projects, retention is the retention of paying users. And retention of non-paying users can be used as a signal that it’s time to convert these users into payment.
Also, for SaaS, churn is often considered an outflow of users. This metric is the opposite of retention metrics in meaning and means the number of users (or money) who left the project during the period.
At the same time, if you measure churn not in users, but in money, then you can (and should!) try to make this churn negative. In general, an interesting metric, perhaps the only one of its kind: if it is less than zero, it’s fine.
A negative churn in money is a situation where existing users start paying more, and this increase covers the outflow of money from users who have left the project. Thus, in order to achieve a negative churn in money, it is necessary to work on retaining users who are preparing to fall away, and on increasing money from active users (for example, to offer them other tariffs).
So we smoothly approached the metrics of monetization.
Monetization metrics
Speaking of ARPU (= Revenue / Audience), I want to note that there is no point in counting ARPU every day (or ARPDAU). This metric won’t tell you anything. Count it only by months (take the income for the month and divide it by the monthly audience, MAU).
Also, a special category of metrics is used for subscription-based projects – MRR (monthly recurring revenue). Or ARR (annual recurring revenue), if we are talking about an annual subscription.
MRR is divided into:
- Churned MRR – the money we lost from the departure of users who stopped subscribing within a month;
- New MRR – money we received from users who subscribed within a month;
- Expansion MRR is the money we received from users who switched to more expensive tariffs within a month.
Thus, for each month you need to count the metric:
MRR = New MRR + Expansion MRR – Churned MRR
Please note that MRR is not the total income of the project. This is an indicator of the qualitative changes that the project has undergone in a month, expressed in money. To maximize MRR, it is necessary to reduce Churned MRR (work on retention), increase New MRR (be open to new users and successfully convert them) and Expansion MRR (offer other tariffs to already paying users).
Another important metric is LTV. About how to count LTV, they write articles and books (I personally wrote several articles, for example, there is one like this). Here I would like to share a simplified formula for calculating LTV for subscription-based projects.:
LTV = subscription price / churn
The formula looks too simple, right?
Let’s take an example.
Let’s say that in the first month we have 100 users who have subscribed, and the subscription cost is 50 rubles per month. The churn of the project is very high and is 90%.
We receive from users in the first month: 50 * 100 = 5000 rubles.
The next month, 90% of users leave the project, and only 10 users remain. From them we get 50 * 10 = 500 rubles.
After a month, only one user remains, and we get 50 rubles from him. And then he disappears.
In total, we received 5,550 rubles from 100 users. That is, on average, we received 55.5 rubles from one user.
Now let’s calculate LTV using our formula: LTV = 50 / 0.9 = 55,(5) rubles. It works!
In fact, this formula only works for cases when the churn of users does not change from month to month, that is, the probability that the user will move from 1 month to 2 months coincides with the probability of moving from any month N to month N+1. But this does not always happen.
In addition, this model does not take into account the Expansion MRR, which exists in a large number of projects.
If you want to find out how LTV is considered more complex methods, but more precisely, we invite you to watch our webinar, in which we discuss with Ultimate Guitar analyst Evgeny Gilmanov all the subtleties of analyzing subscription-based projects, including the exact calculation of LTV.
Activation
In subscription-based projects, it makes sense to divide activation into two stages:
- primary activation. The user visits the site (or downloads the application), studies it, answers the questions “what is it?”, “how will this change my life?”, “how much will it cost me?” and decides whether to return to this project again (or, for example, whether to activate the trial version);
- activation to a subscription. The user passes the trial and decides to subscribe for the first month.
Actually, it is necessary to optimize both activation stages. In such projects, it is especially noticeable that the first session and the first time of using the project is the key moment to be optimized. The better you have conveyed the benefits of your project to the user, the higher your chances of converting it into an initial subscription, as well as into all subsequent ones.
Perhaps this is not even a feature of the work of subscription services. This is another reminder that optimizing FTUE (first time user experience) is important.
Segmentation
Analyzing all users of a subscription-based project, you will get the values of the “hospital average” metrics and may make incorrect decisions.
In order for your decisions to be more balanced, you should analyze each segment separately and calculate all metrics separately for users of this segment
Which segments do I recommend highlighting:
- paying and non-paying users (if at least something can be done for free in your project);
- subscriptions are 1, 2, 3 months and so on. By considering users who renew (or do not renew) their subscriptions, you will be able to better understand the nature of the renewal decision, as well as measure the probabilities of renewal from month to month.
- segmentation by tariffs. Each tariff is a separate segment.
I also recommend using cohort analysis to study such projects. It will allow you to monitor the dynamics of users over time, and notice qualitative changes in your project.
Usually, for cohort analysis, users are grouped into cohorts by days (in our case, months) of registration and some metric is measured in time.
For example, let’s take six months from the life of the project, consider separately the cohorts of users registered in each of the months and study what percentage of users remain in the project from month to month:
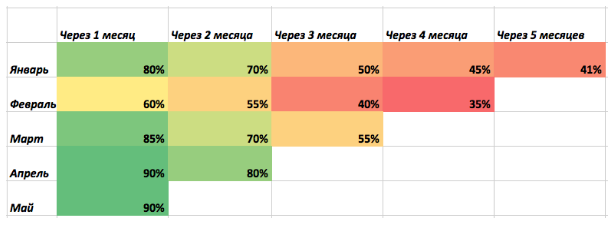
Analyzing this table from top to bottom, we see qualitative changes in the product. In particular, let’s pay attention to the first column: something happened in February, which caused there to be much fewer users, but then the project took a course to fix it, and from May to June 90% of users remained in the project.
Analyzing the table from left to right, we monitor the behavior of a specific cohort of users registered in one month. If you look at the first line, you can see how many percent of the original number of users remains when moving from month to month. And, by the way, in the first line, the transition from 70% to 50% looks very sharp – this is an excuse to figure out what problems these users faced that month.
These, in our opinion, are the main features of the analysis of subscription-based projects. Even more material on the topic is in the webinar above, we highly recommend watching it.
And let your money churn be negative, and the traffic pays off in three, no, two months!