Alexander Neberekutin, co–owner of DevGame, which develops projects for brands such as Fixiki, told using his own examples how to analyze the behavior of children in applications and increase the performance of games with small changes in the UI.
The report was read at White Nights St.Petersburg 2017. We have prepared a printed version of the speech.

Alexander Neberekutin
In this article I will talk about analytics in children’s games and applications. I’ll start with the problems.
Three problems of analytics for children’s apps
What is the problem with the analysis?
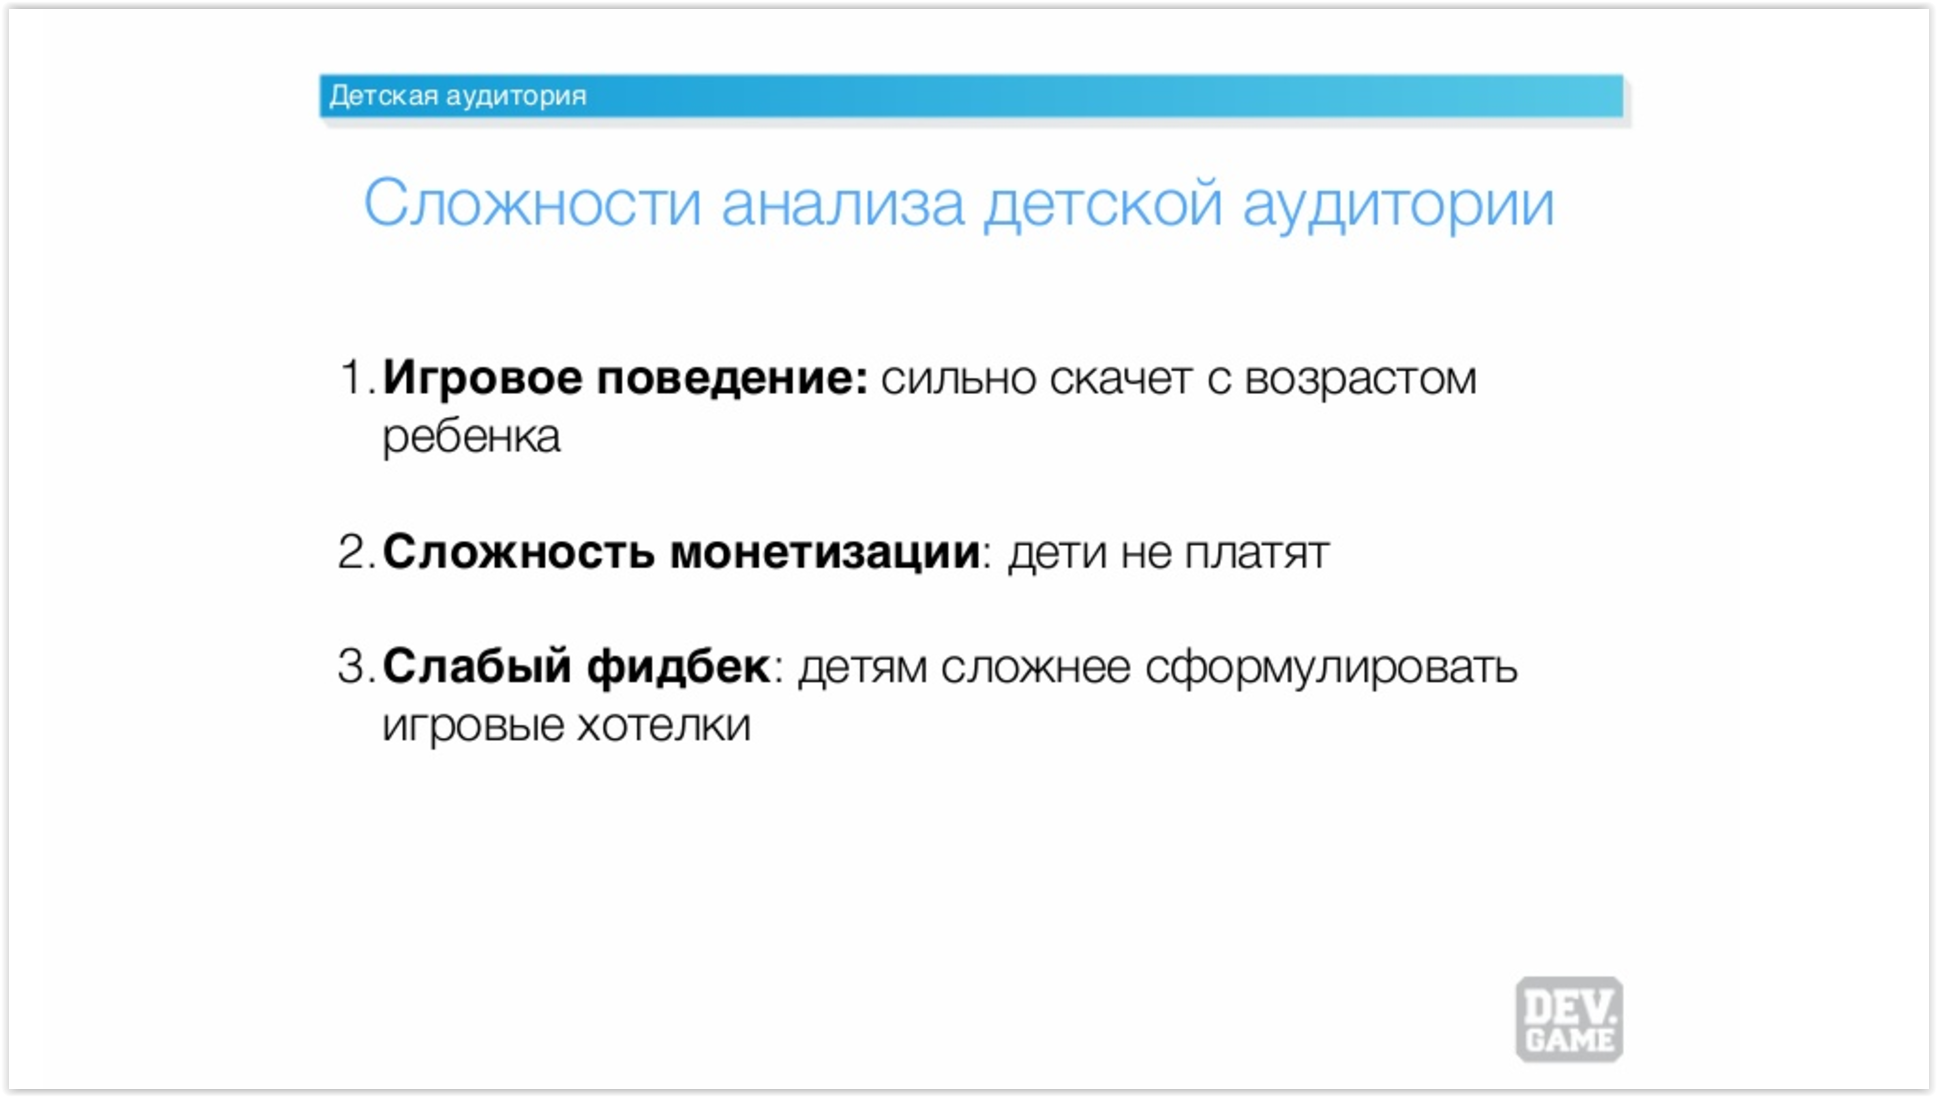
Firstly, analytics in children’s games is very different from the analytics of “adult” projects. The gaming behavior of a user over the age of 16 is strikingly different from that of a user of 3, 4, 5 and further years. It is often easier to predict how an adult user will behave than how a child will behave.
Secondly, it is very difficult to monetize children, you need to approach this quite flexibly.
The third problem is a weak feedback. Children often cannot formulate their thoughts correctly: how they see what they want to add, and so on.
Why do you need analytics in children’s apps?
It’s simple: we use analytics in order to earn more. Everything else is just a consequence.
Since it is difficult to monetize users in the children’s segment, analytics turns out to be one of the most important tools for making money.
How and what tool do we use for analysis?
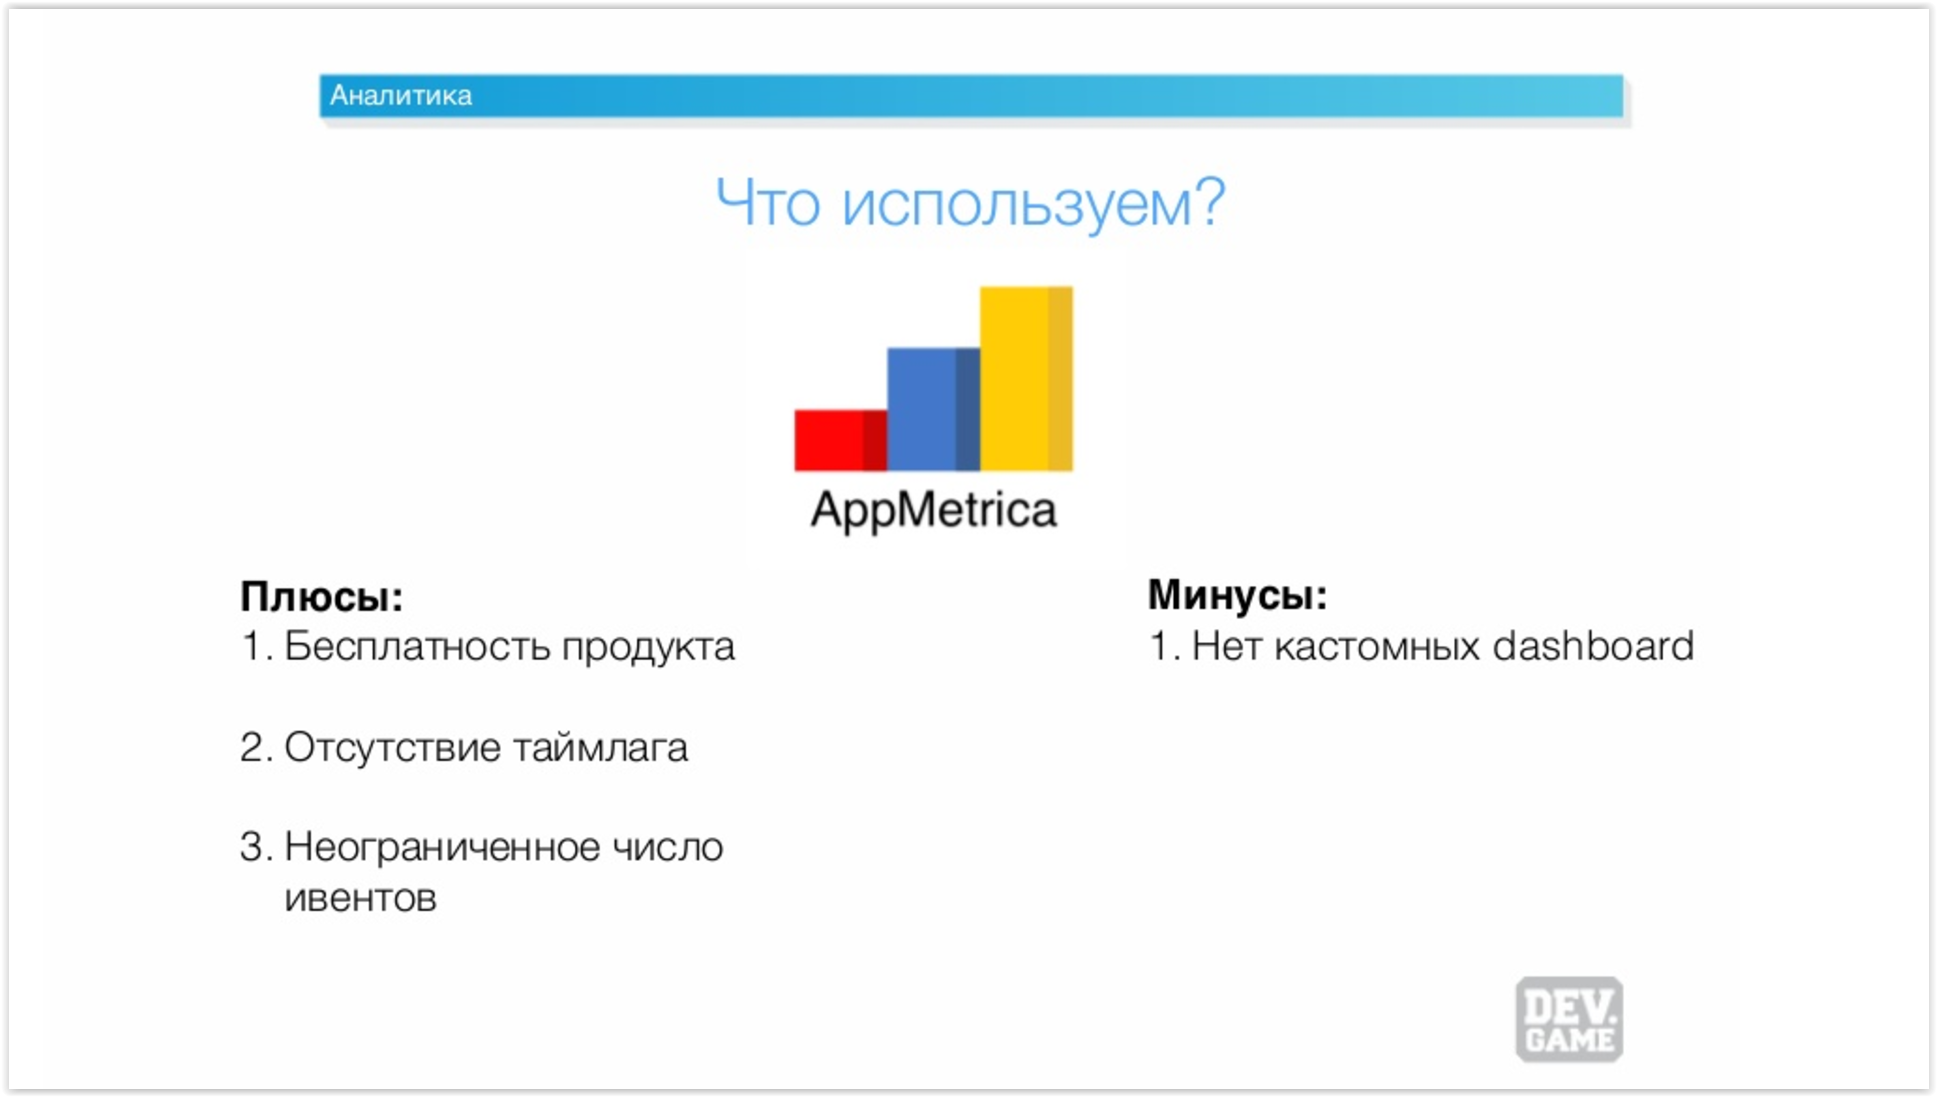
We use AppMetrica.
Why do we use it?
There are three reasons for this. The first is that the product is free of charge. The second point is the absence of a time lag. The third point is an unlimited number of events. Often large services do not have this.
But, of course, AppMetrica is not without its drawbacks. The main drawback for me personally is the lack of a dashboard. You can’t configure the metrics you want to see – ARPU, LTV, and so on.
The main scope of application of AppMetrica is: event analysis (analysis of user behavior within them) and monitoring of key indicators, we also use it for in-game balance and monetization settings.
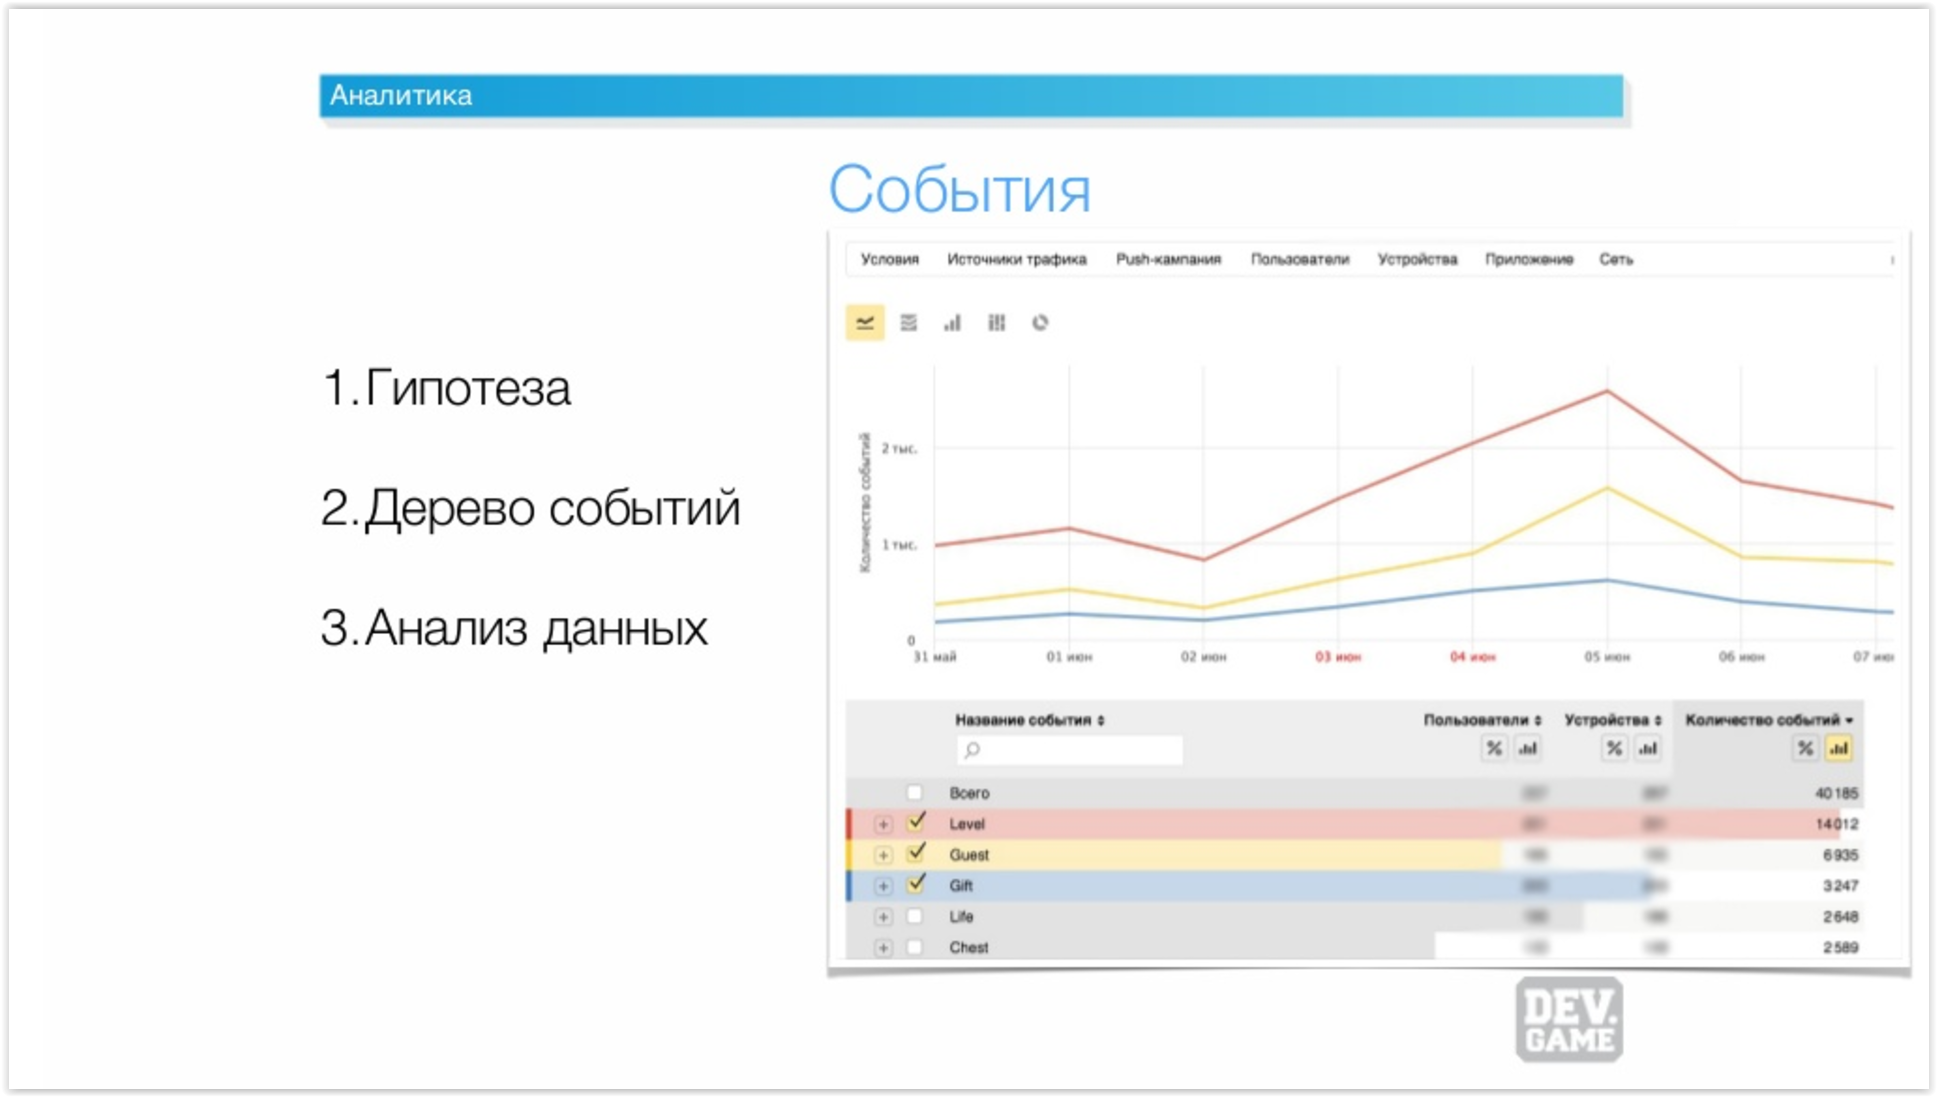
How do we analyze events?
We form a hypothesis, build a tree of events based on this hypothesis, and then analyze the data. It’s convenient to do this in AppMetrica, because the data arrives almost instantly, within a couple of minutes, and by launching the build today, you can see what’s going on inside by the evening.
Next, I want to explain in five stories how analytics helped us test unexpected hypotheses and, as a result, increase metrics.
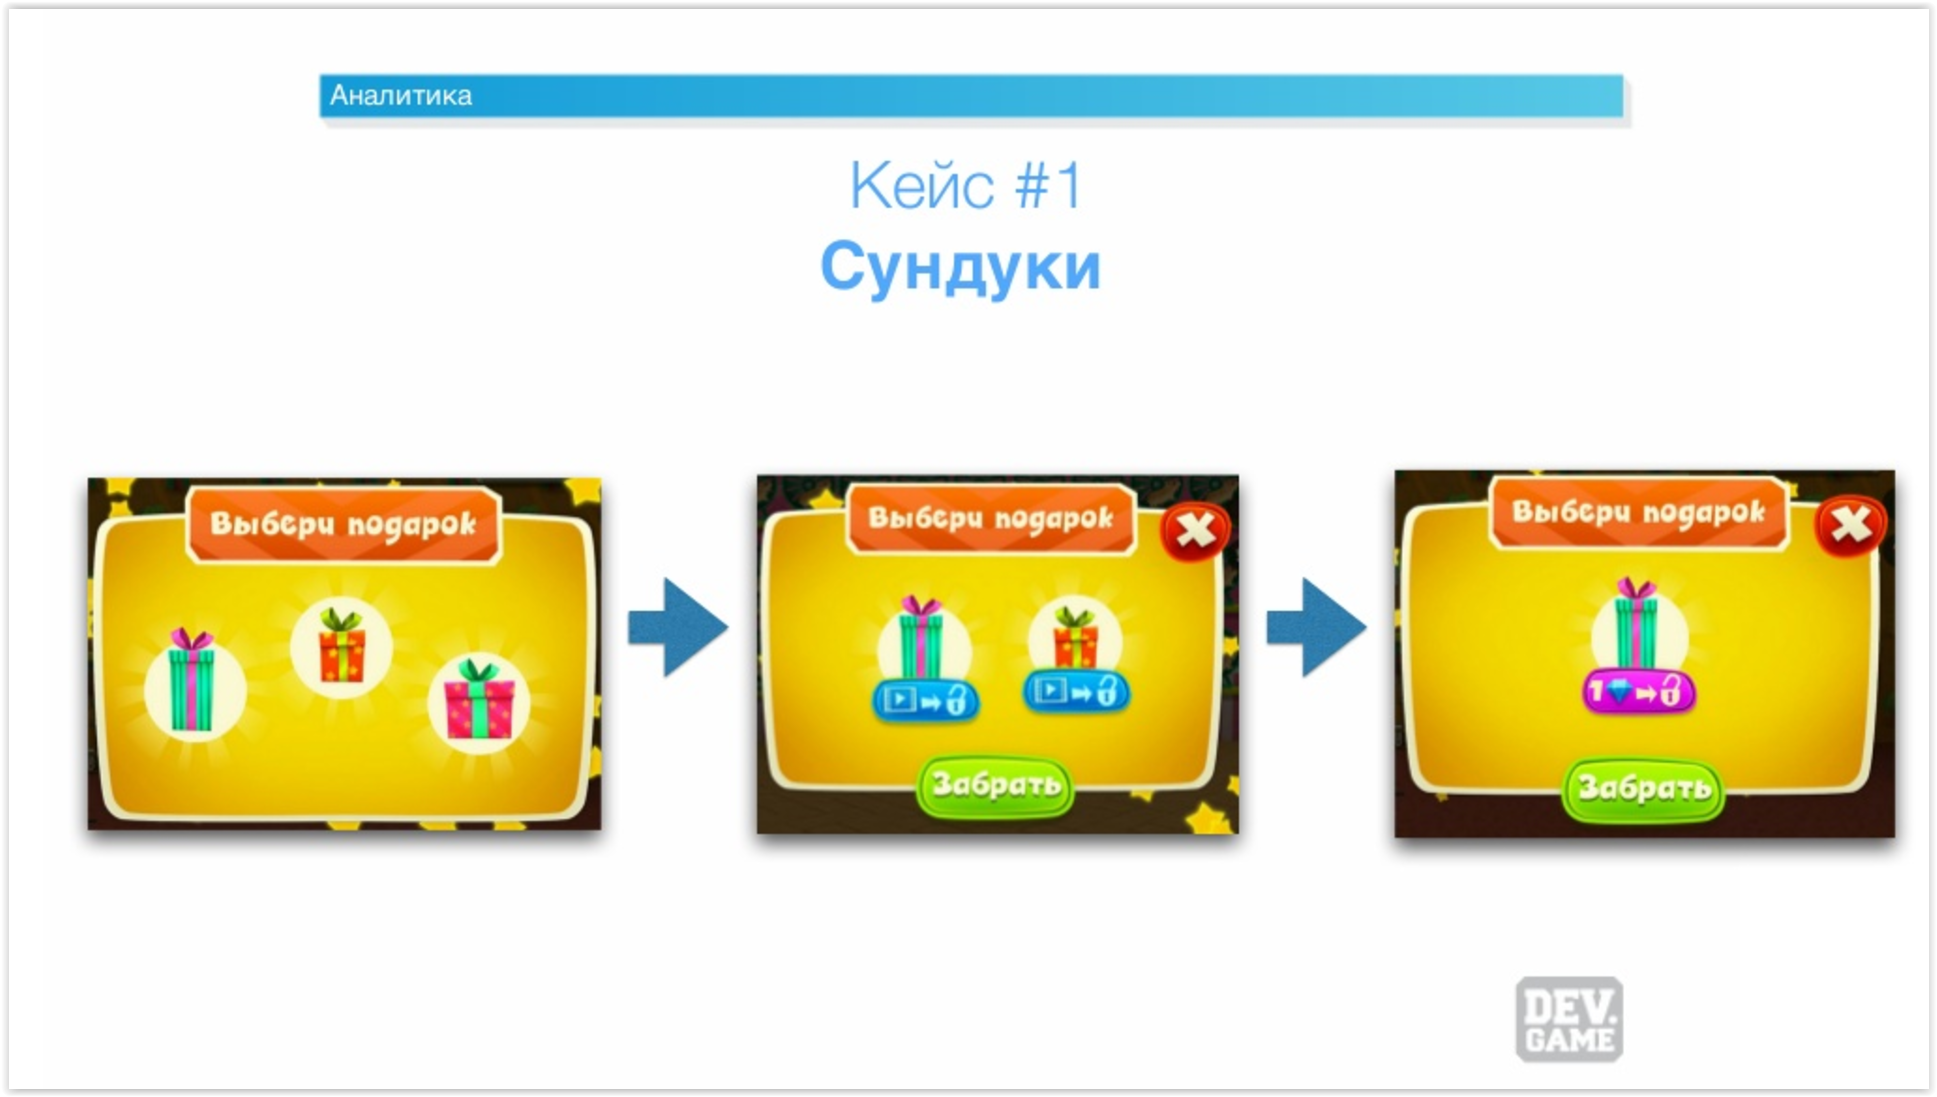
Case one: chests
We have built a chest system into one of our games. I think everyone knows what it is – this is when a user for certain actions or achievements drops a chest that needs to be opened. Inside this chest there may be some kind of currency, characters, things, and so on.
How was our system built initially?
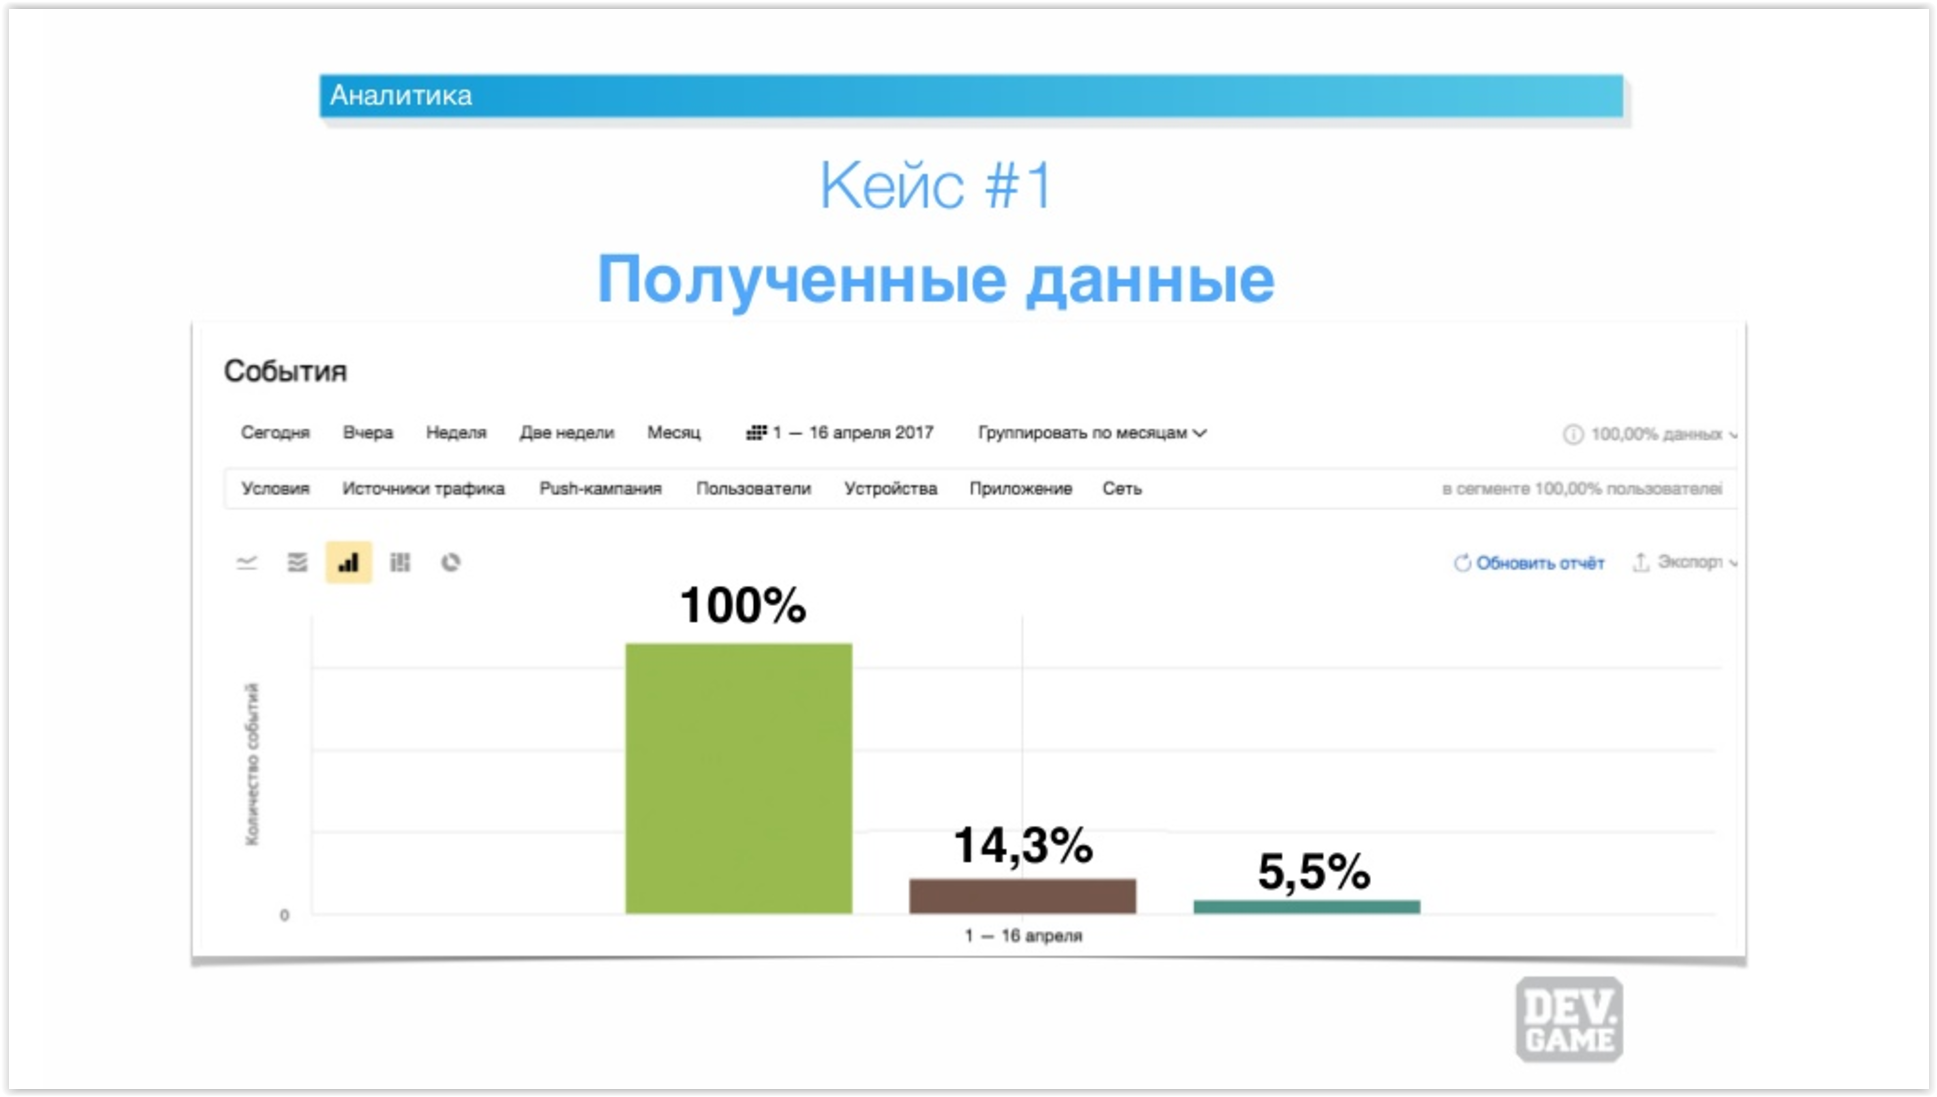
The player was shown three chests and offered to choose one for free. After opening it, the player could open another chest for watching the video. The remaining chest was opened only for the internal premium currency.
We decided to find out if buying a chest affects user behavior.
When we took the data, we saw a very sad picture. Firstly, only 14.3% of users who opened the first chest opened the second one. The third chest was opened by only 5.5% of users.
The worst thing is that the retention of users who opened the third chest was 2 or more times lower than that of other users.
We decided that we need to review the system. We assumed that the situation would change if we stopped asking for currency for opening the third chest, and let it be done for watching a commercial.
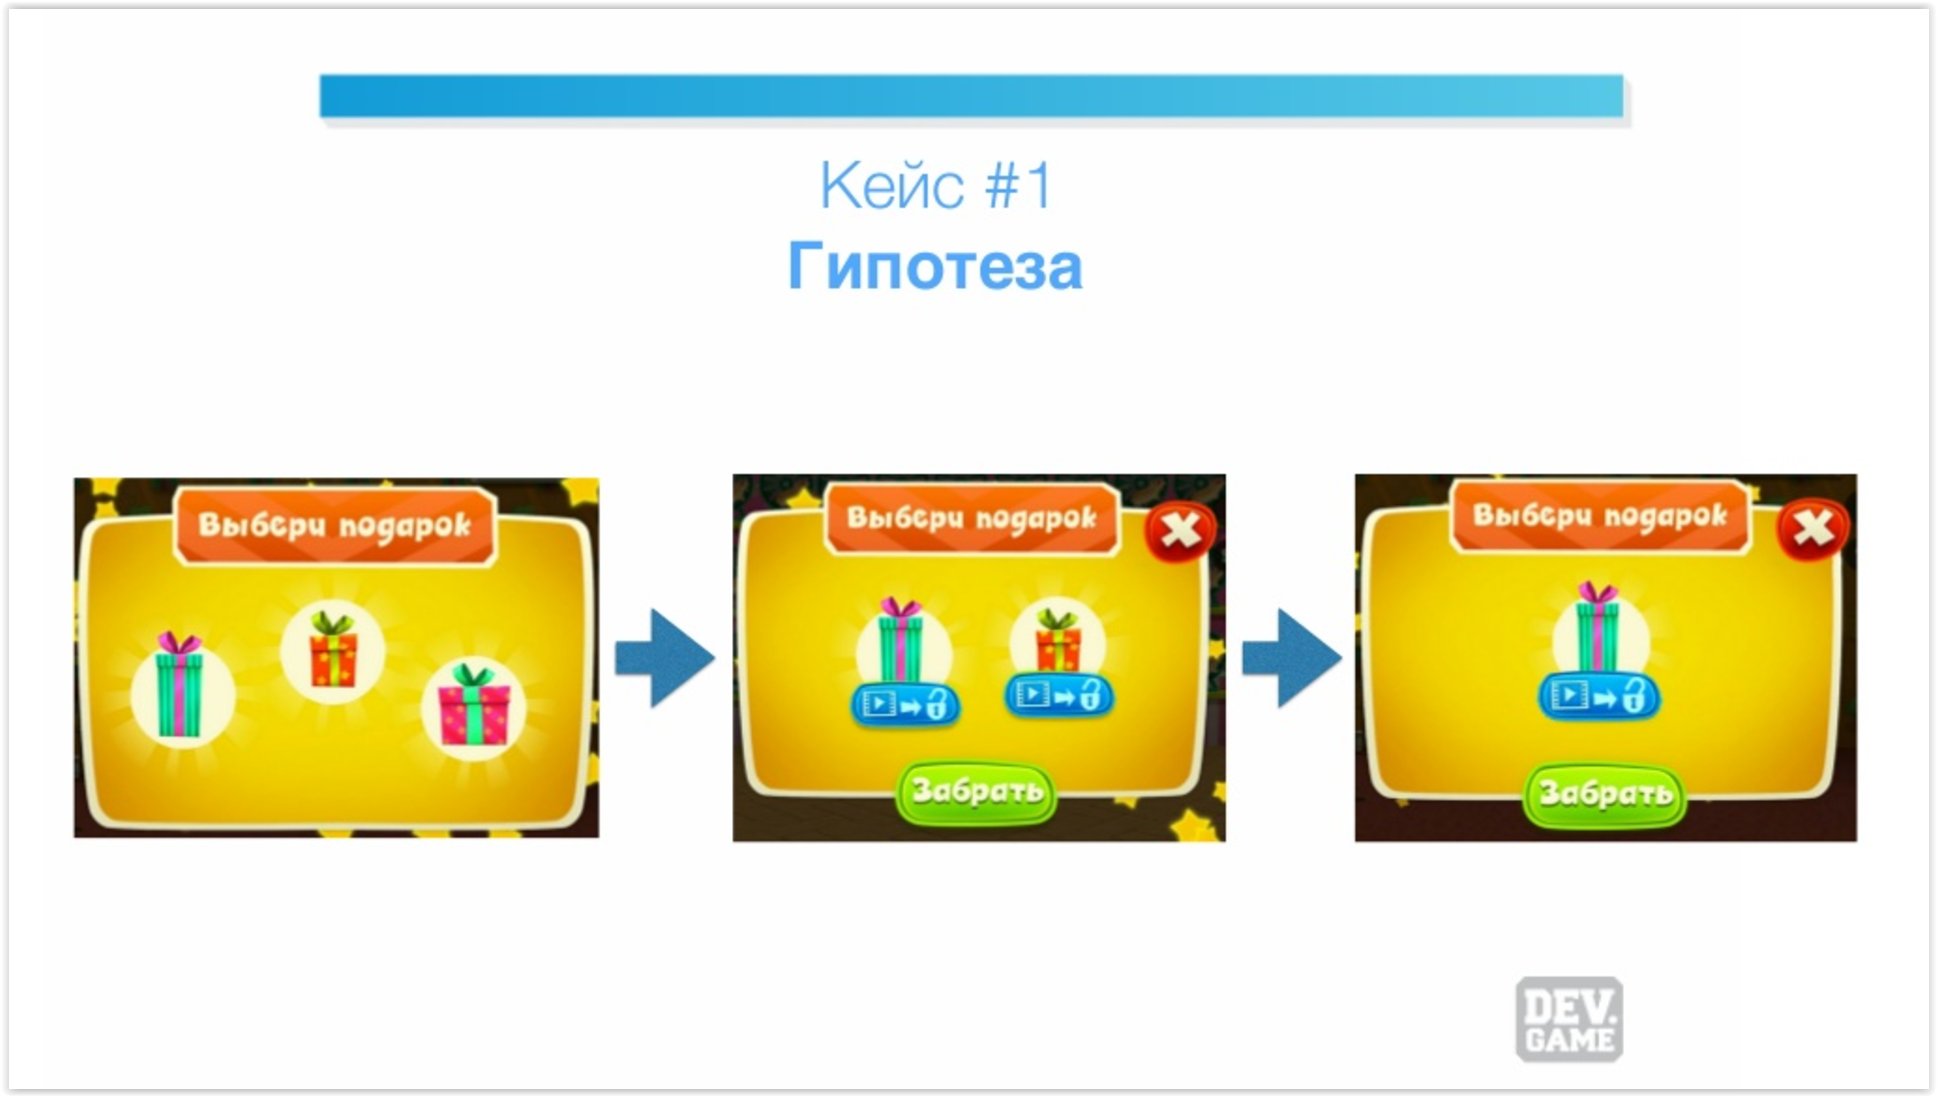
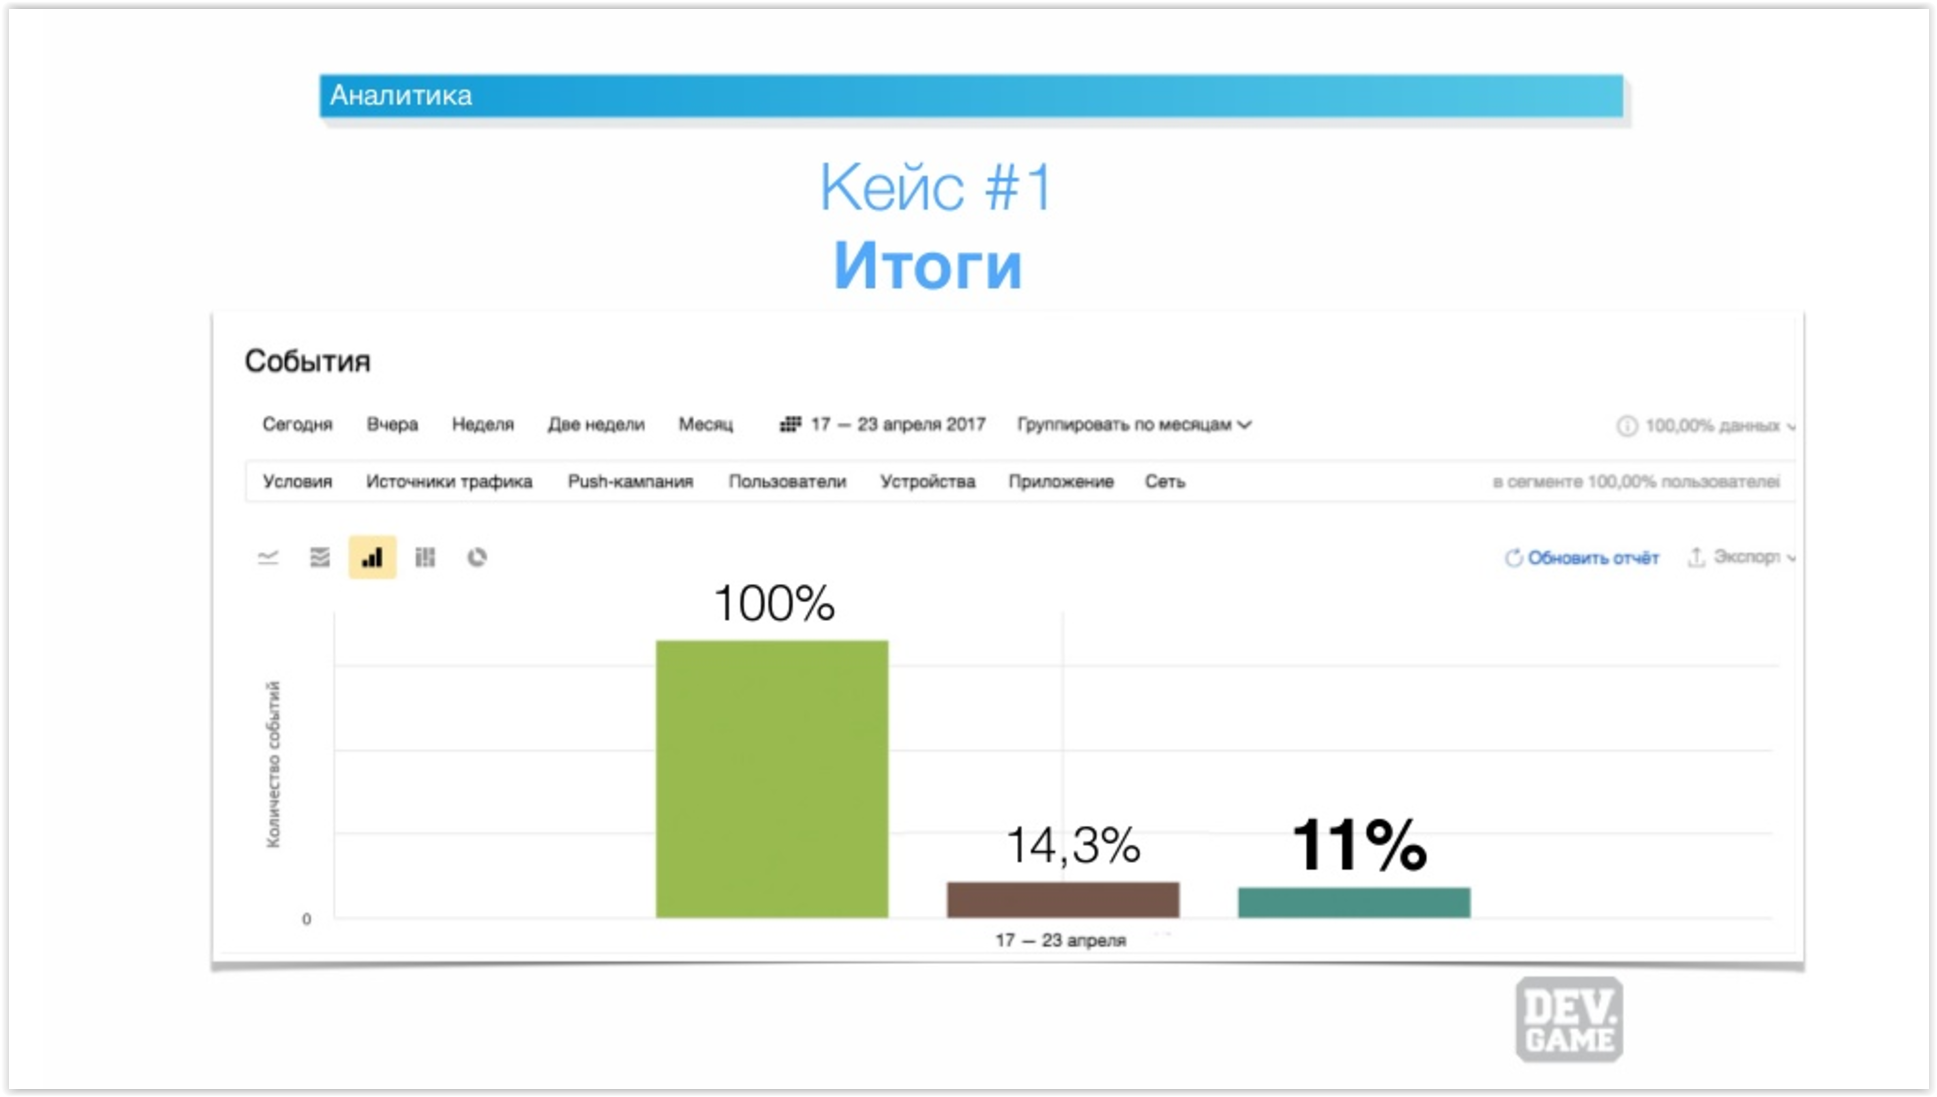
After we implemented our hypothesis, the rate of openings of the third chest increased by 2 times. Along with it, our earnings from advertising increased. As a result, we got a 20% increase in ARPU and a 2-3% increase in retention.
We didn’t stop there, we started experimenting further.
Case two: working with color
Before this case, I will first tell you about color programming.
In short, this is the choice of color for a certain action in the game and its rigid attachment to it.
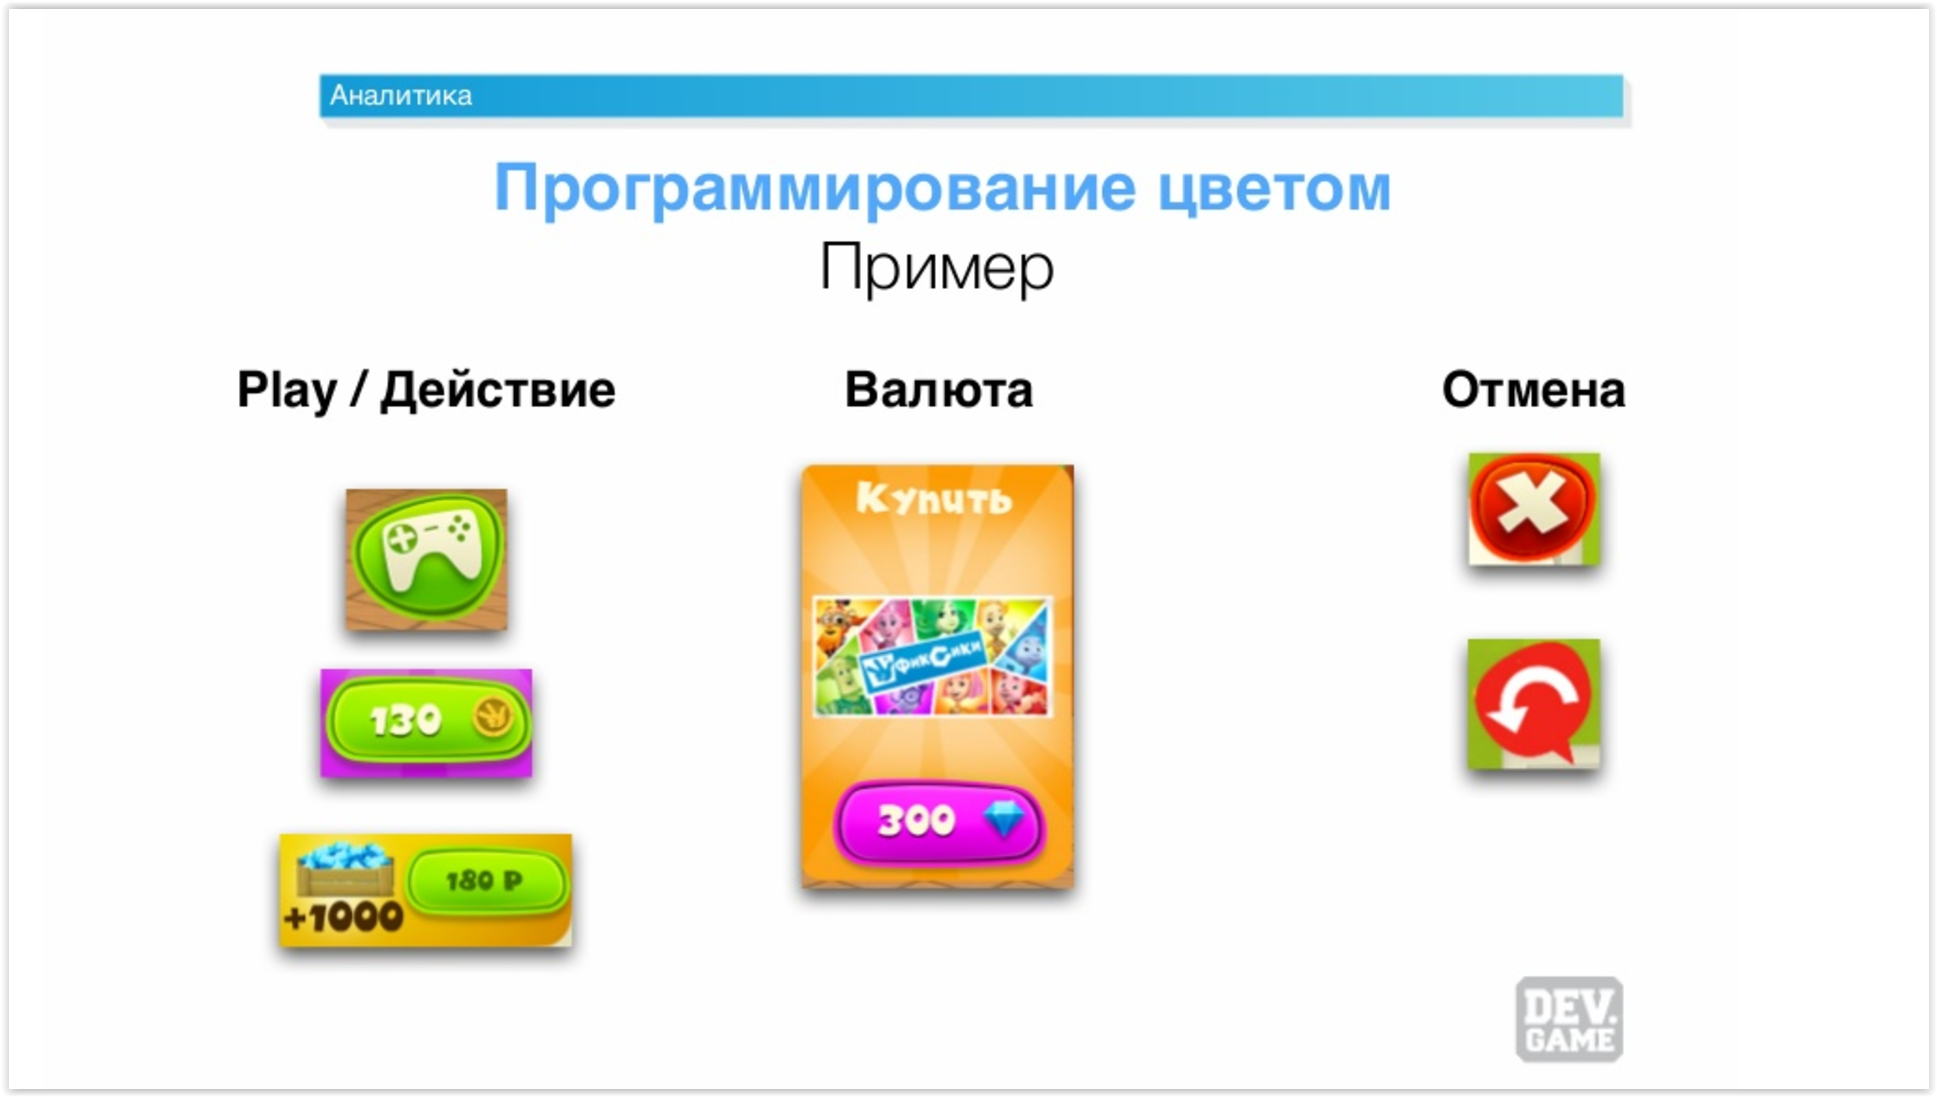
For example, there is a “Play” button. If we make it green, then all the actions in the game should be green. With this, we can push the user to any actions that we need.
For example, we have a green game launch button. The same color is the button for buying a bonus for coins (soft currency). And again, we have a green button for buying crystals (hard currency) for real money.
As for canceling – it’s a red button. And it should be red on all screens.
Let’s go back to the case.
Since the “Play” action was assigned to the green color, we decided to paint the button under the chest in green, clicking on which the player would watch the advertisement. Before that, it was blue.
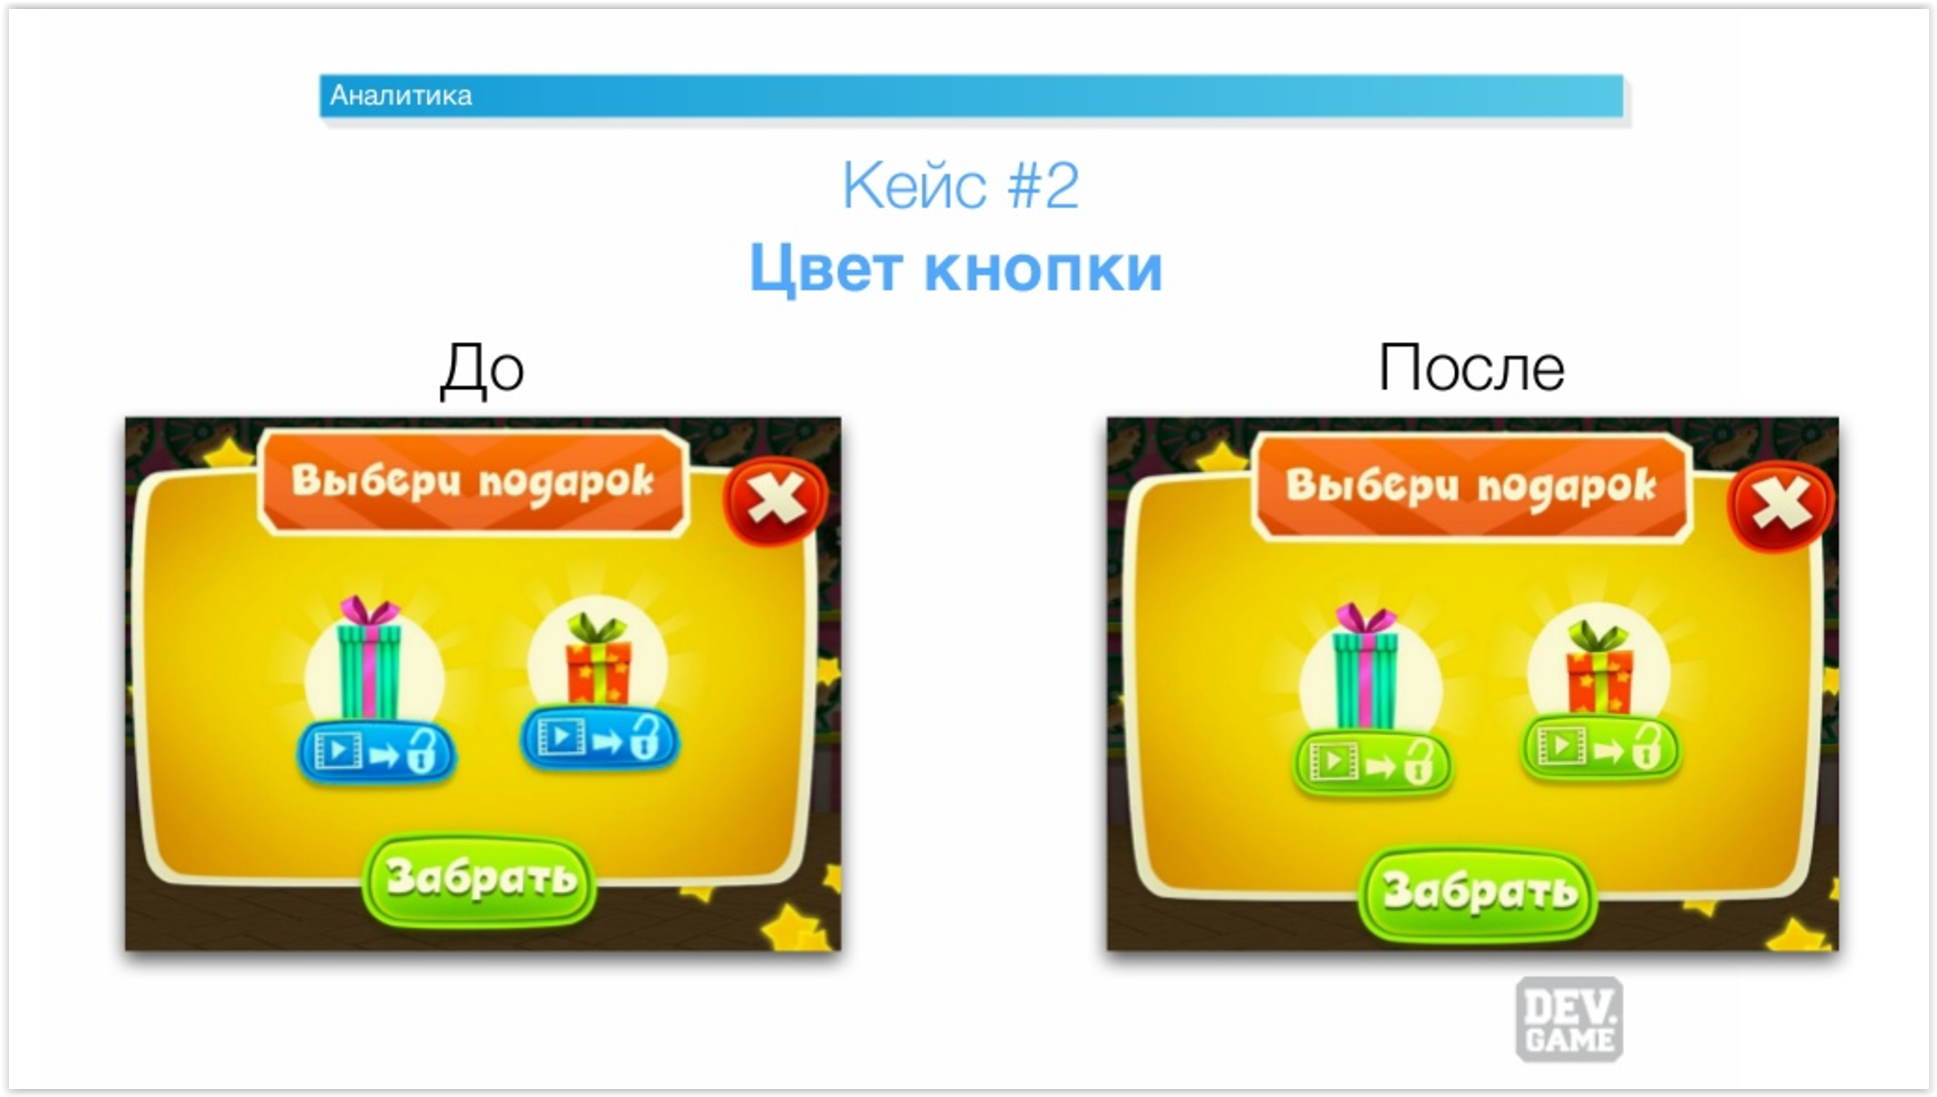
We conducted A/B testing: we launched two builds at the same time. One with a blue button, the other with a green button.
After we removed the data, it turned out that in the new “green” build, clicks on the third and second buttons in the chests increased by 15%. The total ARPU, not only advertising, increased by 10%.
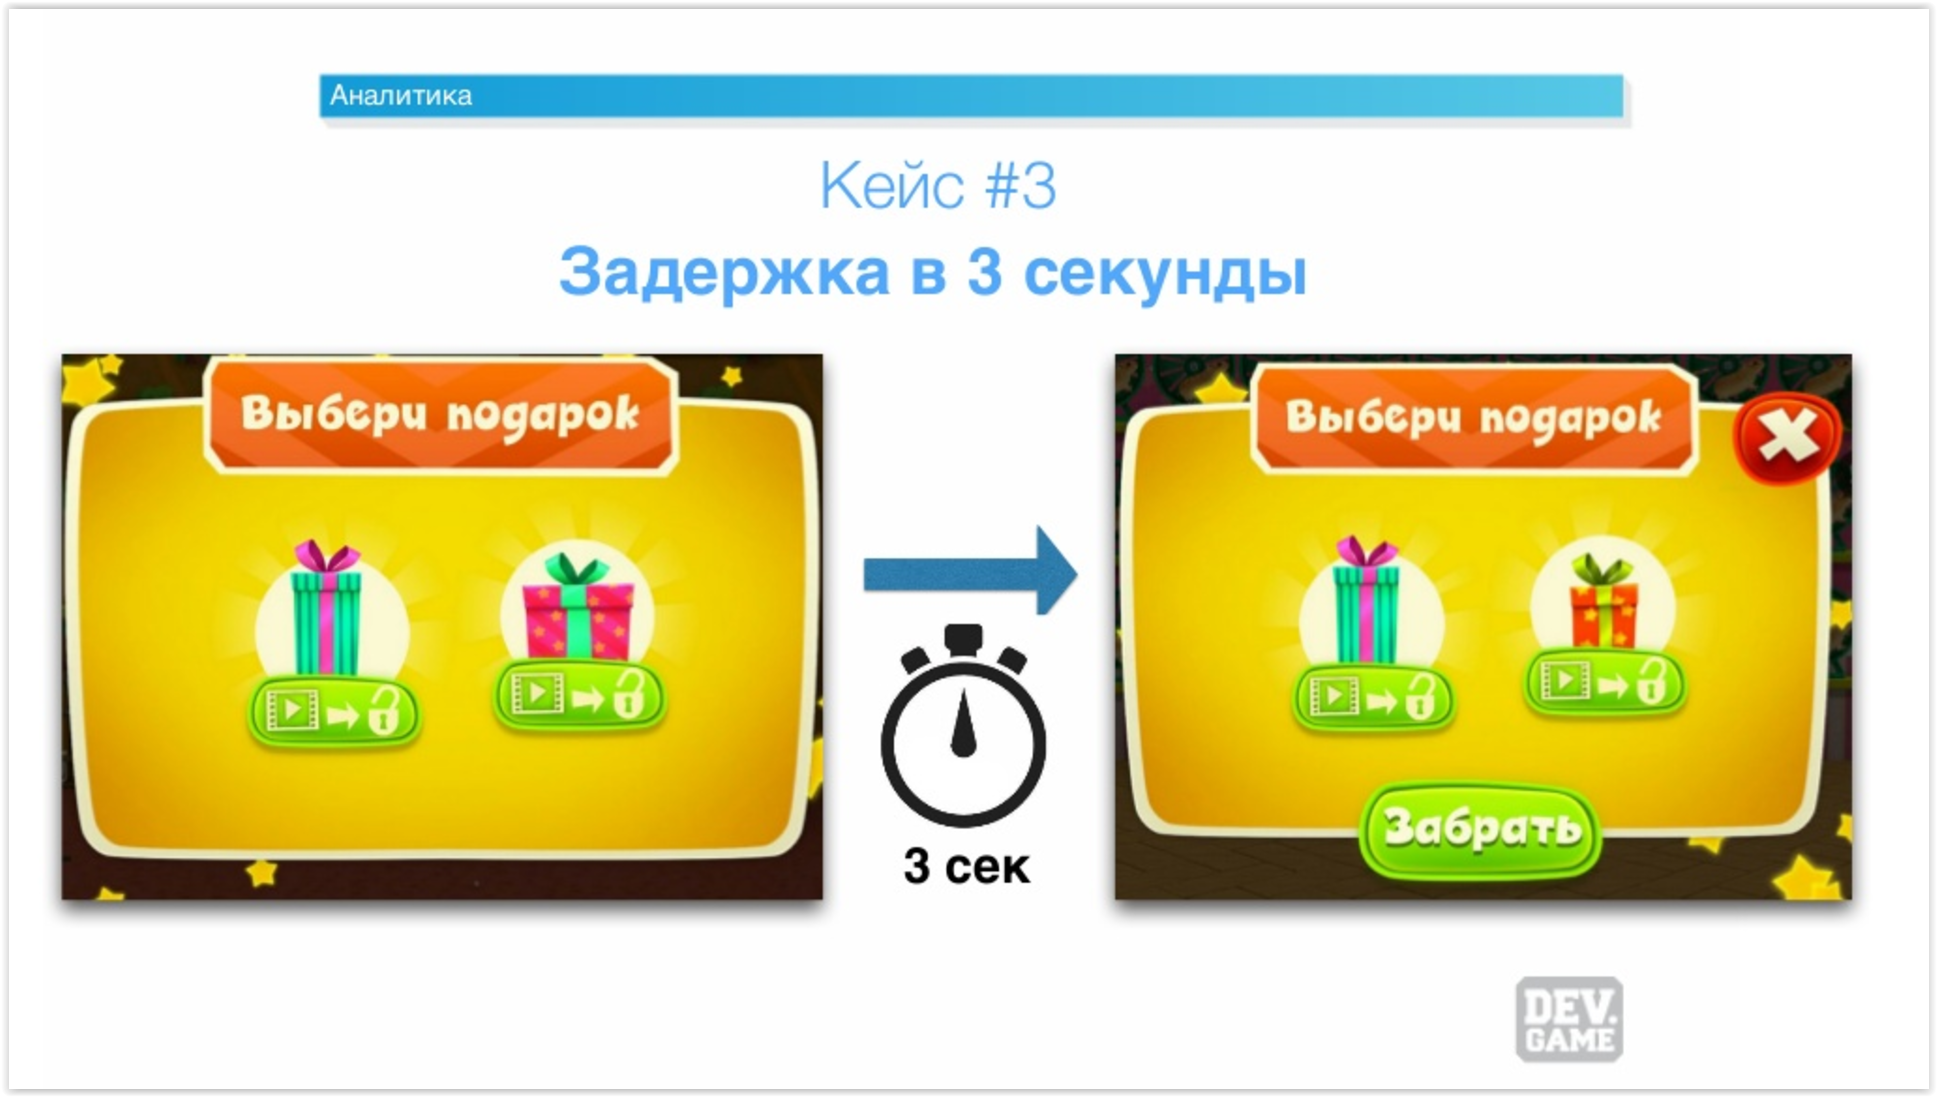
Case three: delay in the occurrence of the exit button
The following hypothesis also concerns the chest screen. Initially, it was possible to exit this screen without clicking “view ads” in two ways: by clicking the green “Pick up” button (the prize from the first chest, which did not require viewing the video) or on the red button with a cross.
We assumed that we would be able to increase ad views if we didn’t immediately show these two buttons. That is, we will limit the player’s capabilities for a couple of seconds, let him just click on the “view ads” button.
In commercials, as you know, this is often resorted to, they force him to watch for 15-30 seconds.
And we conducted an experiment, made a delay of 3 seconds.
By the way, at first the delay was higher, but eventually adjusted by 3 seconds.
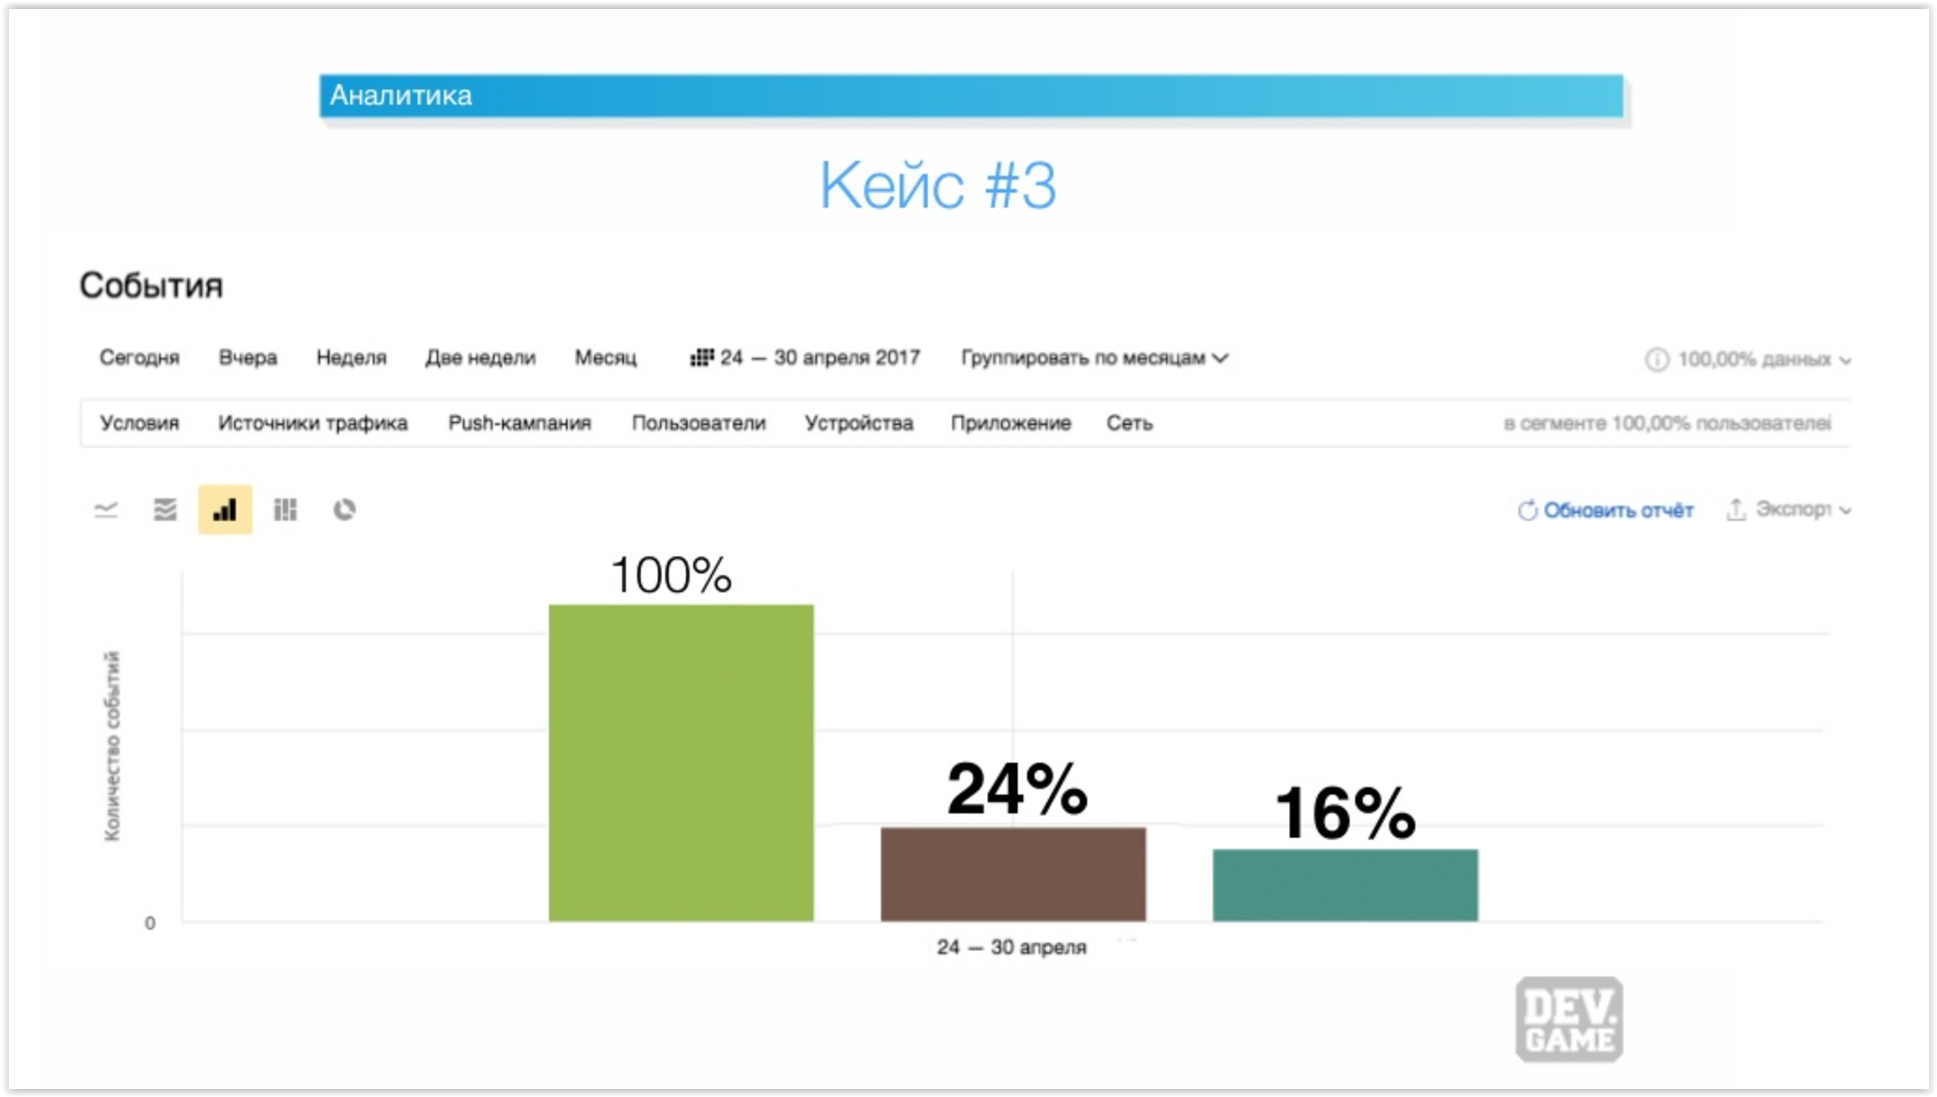
What came of it? We have seen that the opening rates of the second chest and the opening of the third chest have almost doubled. This is a very big indicator. The peculiarity of the audience itself affected here: when the child does not see other elements in the window, except for active green buttons, he taps on them.
Case four: working with events
I have previously talked about events, but did not go into what they are for and how they can be actively used. Using the example of the fourth case, I will briefly tell you about it.
We have an application with a set of mini-games for children and a simple event tree that we built for her.
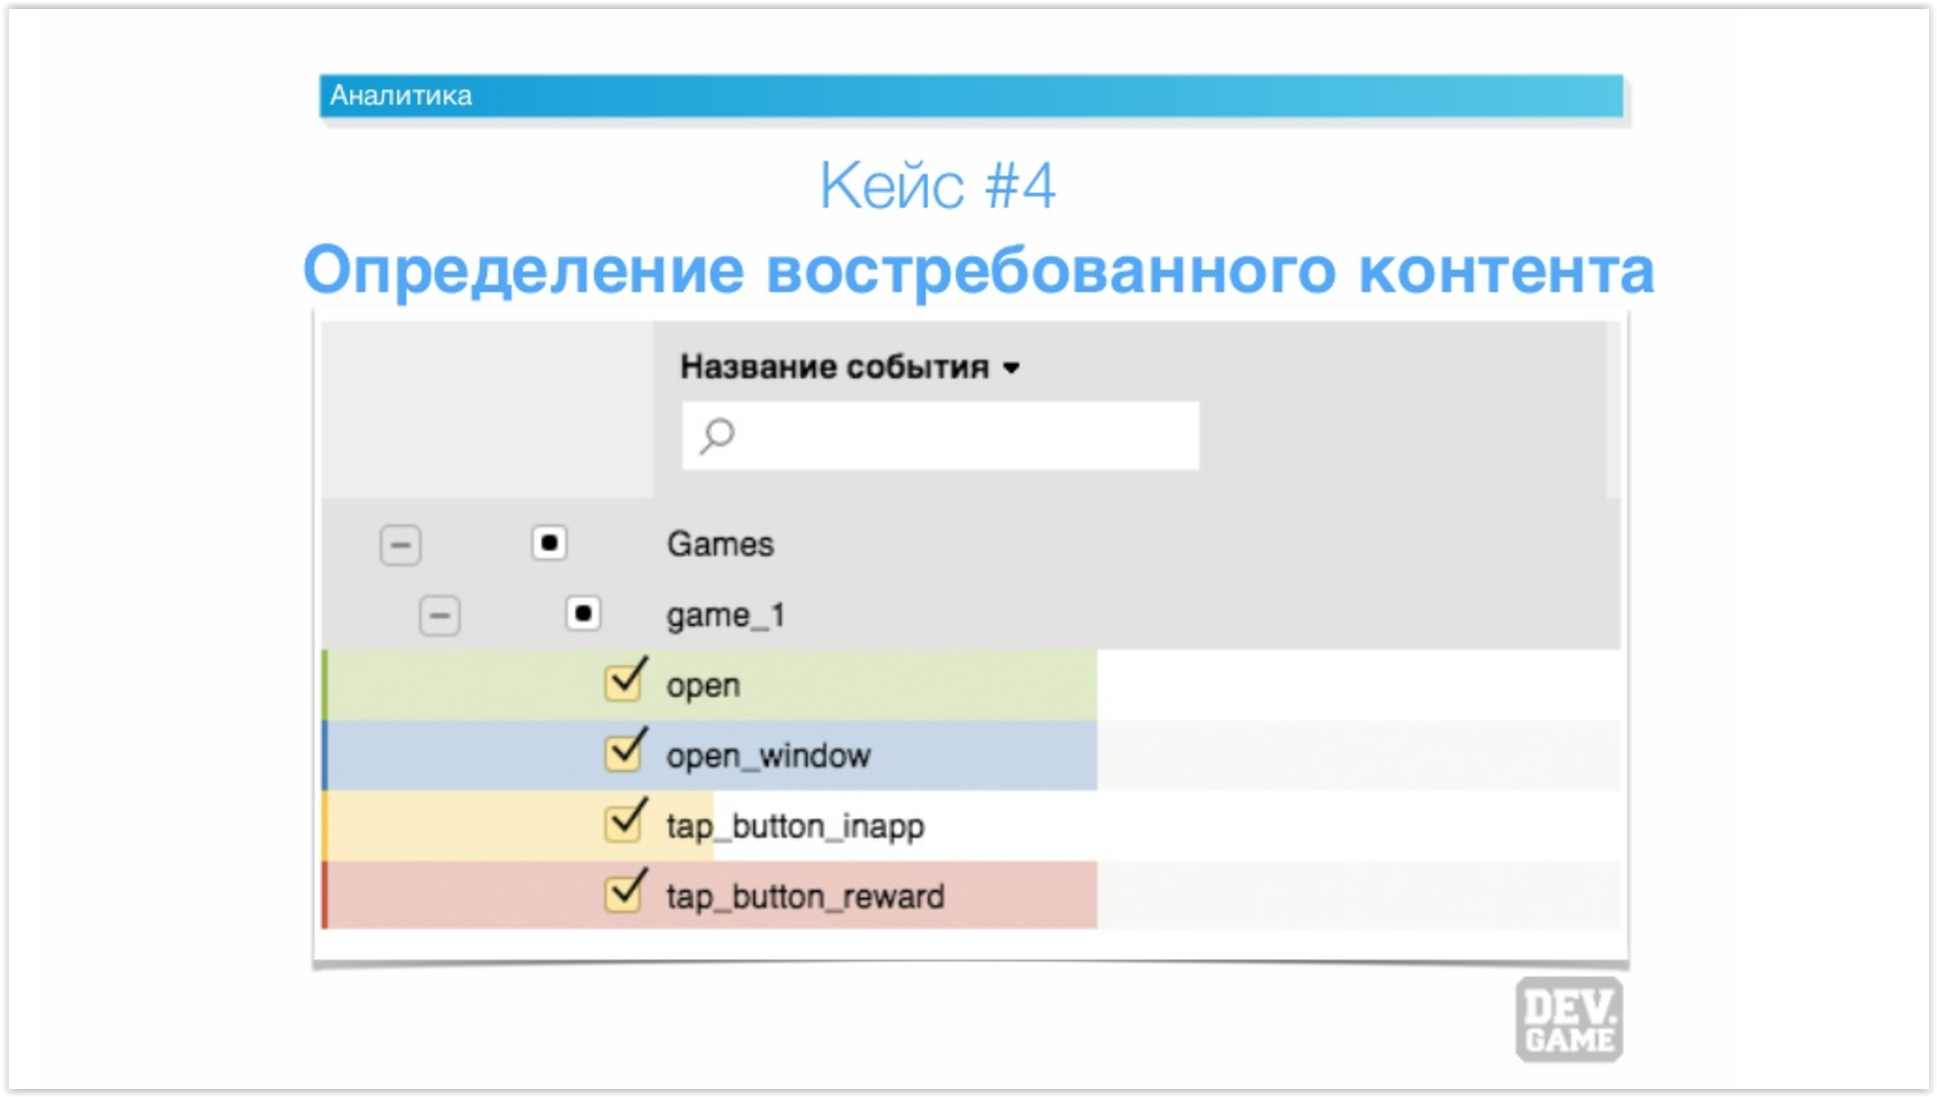
What is shown here?
The top element of Games is a general category, the parent element, which will be easier to search in the event stream. It contains Game 1, Game 2, and so on – the names of mini-games.
What is in them? There is “Opening the game”, there is “Opening the window for watching the commercial”, there is “Opening the full version window”, “Clicking on the IAP button” and “Clicking on the reward button”.
Why did we need it?
When we want to determine which content we want to give to the user for free, which we want to give for commercials or for IAP, for example, it is difficult to make a decision, especially when you are not the target audience of this game.
Therefore, when we are hung up with such events, we can see – aha, the first game is in great demand, because it “comes in” with children or adults. Accordingly, it is better to remove it under the full version of the application (the full version is sold for money).
If we see some average indicators, then they can be removed for watching videos. And if we see that the game is weak, then, accordingly, it will be free, so as not to deceive the user’s expectations when he pays, so that there is no such thing as: “Damn, what did I buy, what kind of nonsense is this.”
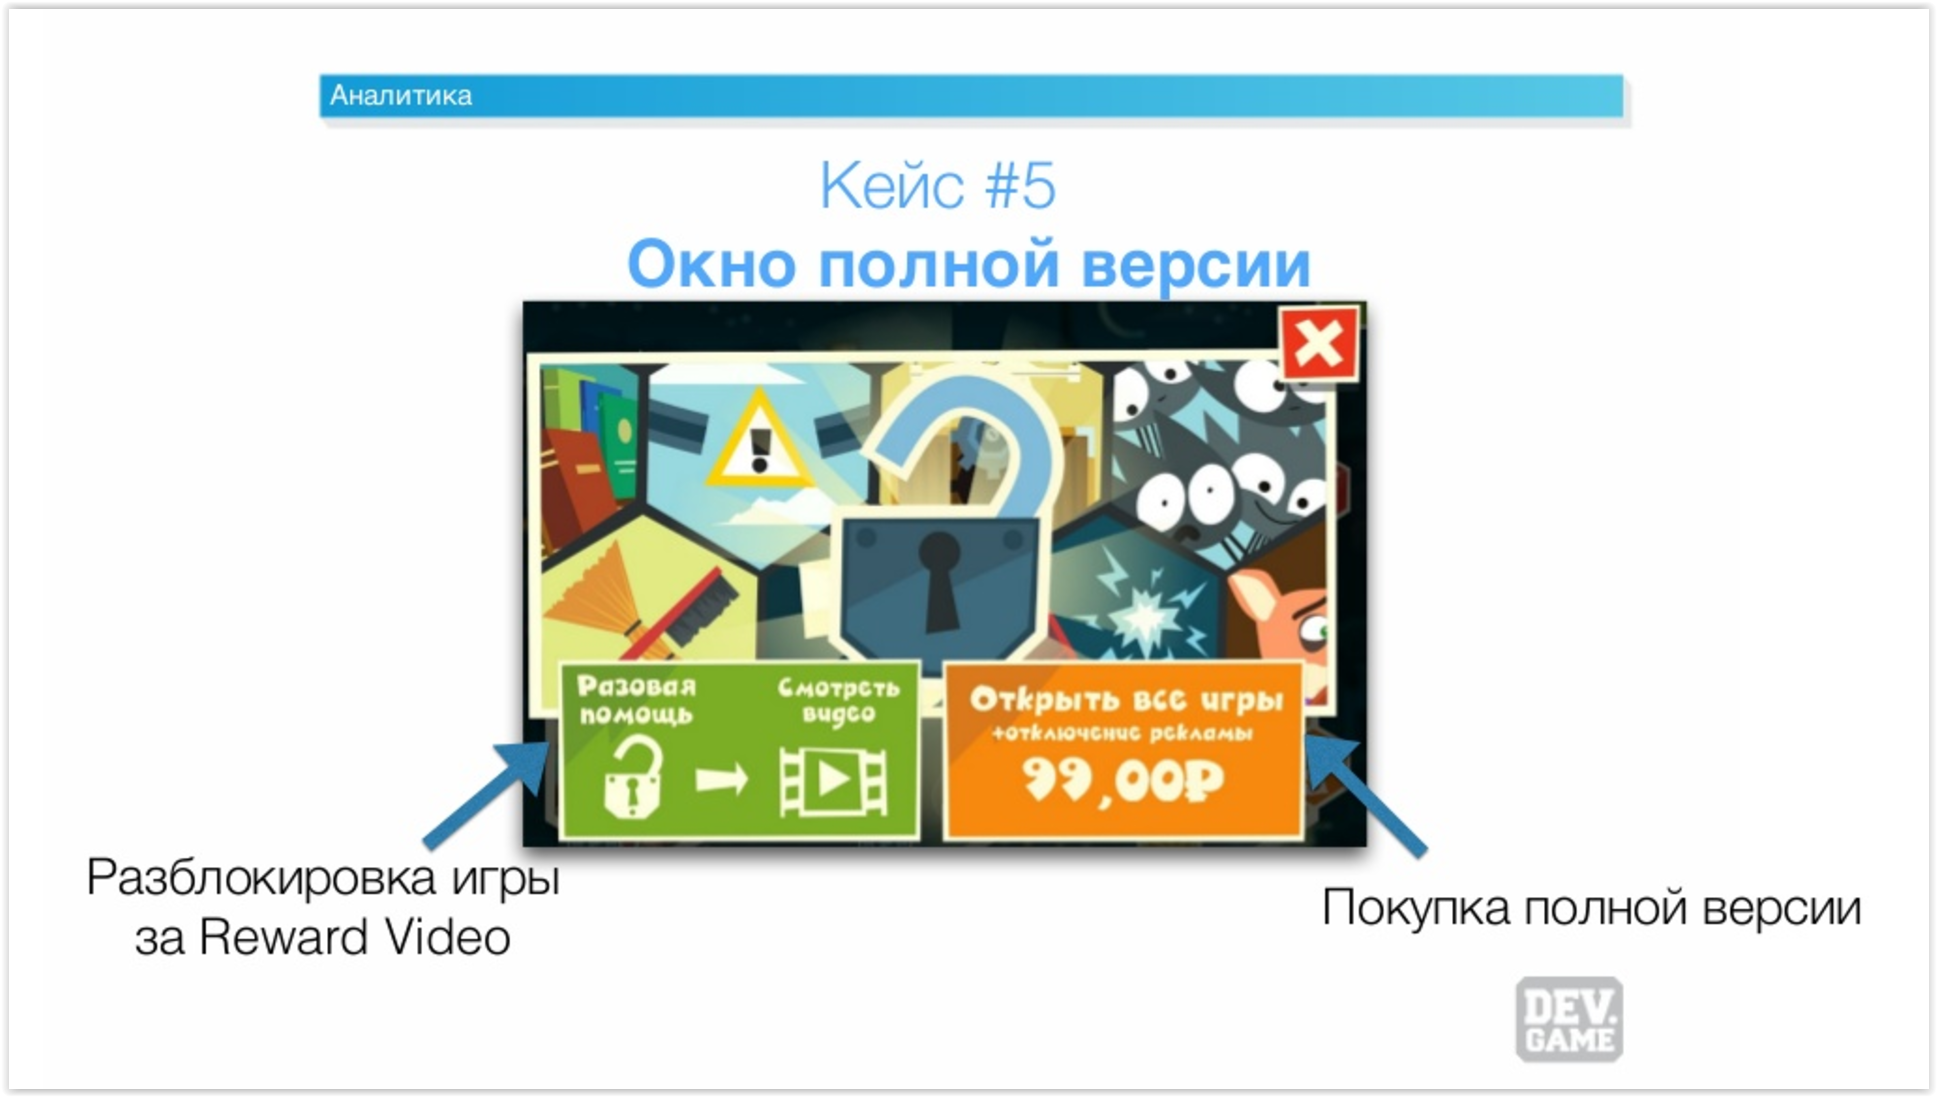
The fifth case: introduction of a window with explanations
We have a project with a set of mini-games called “Fixiki City”. There we currently have 12 mini-games, some of which are free, some of which are given to users for watching videos, some are given for IAP.
Previously, our system was built as follows: in “Fixiki City” there is a large map on which mini-games are located. And each mini-game had a certain icon – a coin, if the game is paid, and an icon with a film, if it opens for viewing ads.
We decided that it would be unintuitive for children and incomprehensible for parents – what they pay for and what they eventually acquire. So we decided to make an intermediate screen.
When tapping on the game, which is given for watching the video, we began to display the “Full version Window”. It immediately explained what the meaning of the signs was and offered to buy the full version of the game without advertising.
What did it lead to? The number of IAPs has increased by 40%.
Now in all our projects it is such a system – although, it would seem, this is an extra element and it should be removed. But in the end, the experiment showed that this is not the case.
Results
There are three main conclusions.
The first. ARPU can be increased by simple manipulations, it is not necessary to redo the balance of the application or change its concept. Sometimes it is necessary to change the color of the button or the location of the cross, and this already greatly affects the indicators.
The second point that I would like to pay great attention to is that game balance and analytics are related things, and you should not neglect this, you should not say that “we will launch now, and we will collect analytics later someday.” This is an incorrect point, and personally I think that those who neglect analytics lose half of their money.
The third point: the overall indicators are good, they show us the vector of movement. If you take the same ARPU, you can see – yeah, among our projects, this project has the largest ARPU, respectively, we pay more attention to it on updates, we invest more resources in it, and so on. But deep analysis is also a very important thing, because without it you will not understand what is happening inside you. And just for deep analysis, the events, the events I have told you about, are very cool.