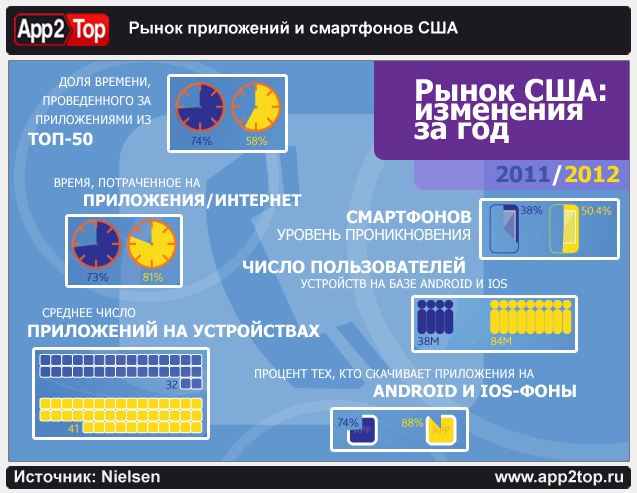
Nielsen briefly described how much the mobile software market in the United States has changed over the past year, sharing a curious infographic.
It turned out that American smartphone users in 2012, on average, put more applications on their devices than in 2011. If last year the number of programs on the “smart phone” of the average American reached 32 pieces, this year it is already 41.

It is clear that along with this, the total number of those who download apps on Android and iOS devices has also grown. Last year there were 74% of them, and this year 88% (here statistics for the last 30 days of 2012 and data for the same period of 2011 were compared).
The smartphone penetration rate has also increased significantly: from 38% to 50%.
The only thing that has decreased, according to Nielsen, is the share of time spent on top 50 applications: from 74% last year to 58% this year. But, in general, the time spent by users on applications, not only did not fall, but even slightly increased: from 37 minutes to 39 minutes a day.
However, not everything has changed. Users, as in the past year, most often log in from their devices to Facebook, YouTube, Android Market, Google Search and Gmail.
