The key game metric in setting up monetization is engagement. DAU, MAU and conversion rates are secondary. Atul Bagga, the former chief financial officer of Zynga in Asia, came to this opinion.
DAU, MAU and other metrics are retrospective. With their help, you can only measure how decisions already made have affected users. And trying to understand on the basis of these indicators whether the players like the innovations and whether they want to pay is like driving a car while looking in a long-view mirror, Bugga is sure.
To understand whether monetization is set up correctly, developers need to know the engagement indicators. This metric reflects how satisfied the user is with the game, whether he is ready to spend time and money. The easiest way to measure engagement is to count the number and duration of sessions. In other words, the more time a user spends in a project, the more involved they become.
The more involved the user is, the more money he will leave in the game.
To prove this thesis, Bugg cites a study of the Chinese market, according to which, regardless of the genre of the shareware game, the user leaves about the same amount of money in the project on average per hour. In other words, if a player spends four times more money in an RPG, then he spends 4 times more time there than in a casual game. Bugga concludes that the players, consciously or unconsciously, but pay for an hour of play.
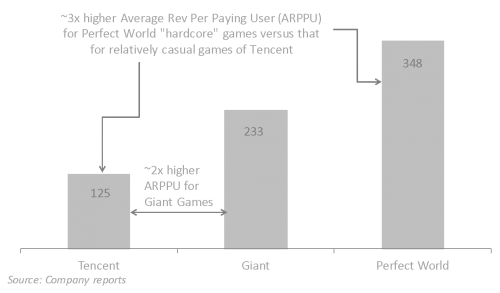
Bugga compares the metrics of three Chinese companies: Perfect World, Giant and Tencent. The first two release hardcore games. Tencent specializes mainly in casual projects. Perfect World and Giant have much higher ARPPU scores than Tencent.
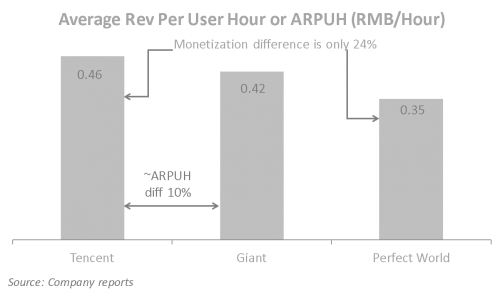
However, if you calculate ARPUH (or the average revenue from a user per hour), it turns out that the indicators are approximately equal. Moreover, Tencent leads: users leave an average of 0.46 yuan per hour in the games of this company.
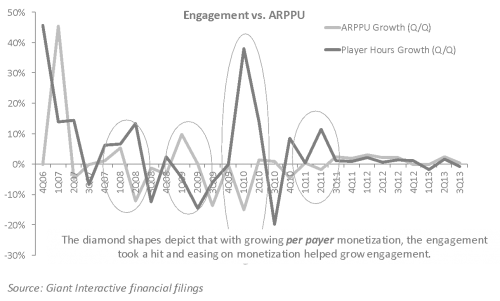
Thus, in order to increase the income from the project, you need to increase the involvement. If you just try to “tighten the screws” by raising IAP prices, then ARPPU will grow. However, engagement will decrease. In the future, this will lead to a drop in revenue from the project. As an illustration of how this happens, Bugga demonstrates Giant’s financial statements. The graph shows that an increase in APPPU leads to a decrease in engagement.
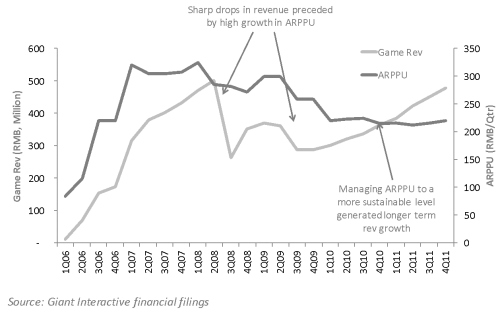
This graph shows how revenue grows after the IAP price increases and the ARPPU increases, and then immediately falls – due to the fact that users leave the game.
Engagement and average revenue from a user per hour are the metrics that game developers need to rely on, Bugga concludes. In order for the revenue from the game to grow, you need to increase the involvement and try to keep the ARPUH indicators within the specified limits. The sharp growth of ARPUH is a warning signal for the developer. This means that short-term revenue increases. In the long term, this will lead to a drop in engagement and then a decrease in income.
Source: VentureBeat


