Our colleagues from GamesIndustry have collected the main figures of the gaming industry for this year in a single infographic.
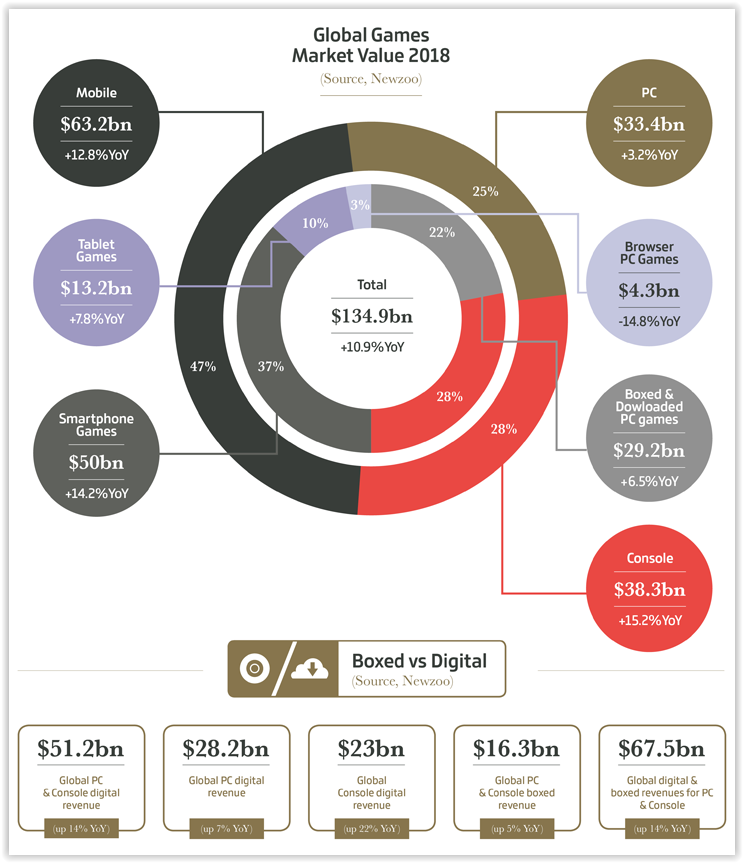
The main part of the work is the assessment of the entire market. By the end of 2018, its total revenue will be $134.9 billion. And of these, $63.2 billion (47%) will be on mobile. Consoles and PCs still earn more — $67.5 billion.
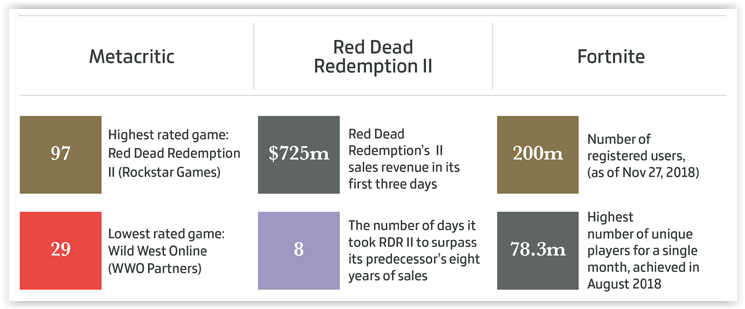
Special attention in the infographic is paid to the projects Red Dead Redemption 2 and Fortnite. The first turned out to be the most highly rated game of the year on Metacritic, and also managed to earn $725 million in the first three days. The second one overcame the mark of 200 million users.
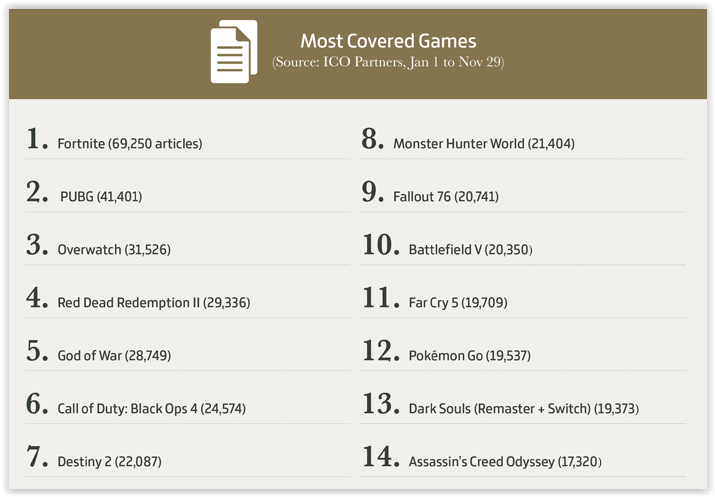
GamesIndustry also found data on which games were most actively written about throughout the year. At the end of November, Fortnite was again in the top. Of the mobile games in the top, only Pokémon Go is represented.
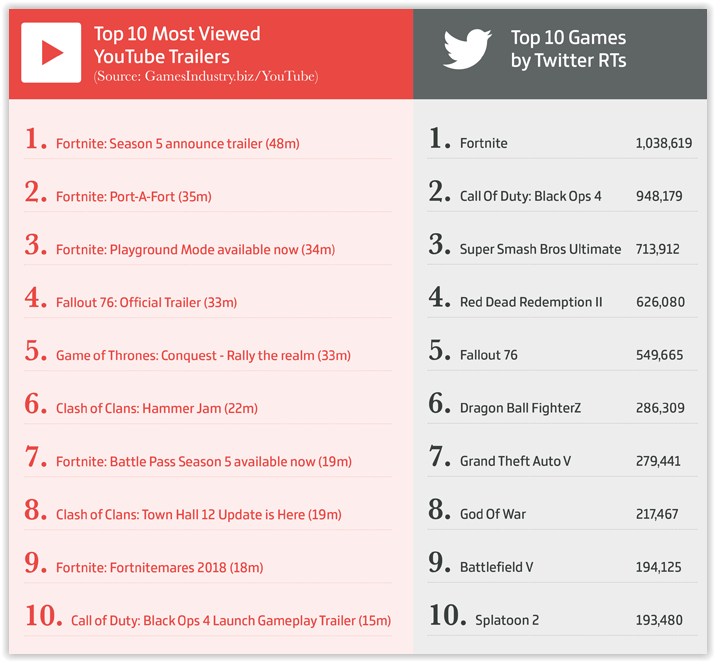
Epic Games’ Battle Royale also leads in the number of views of its trailers and in the number of retweets. By the way, there was a place for an elderly mobile project in the top of the most viewed trailers. Videos about innovations in Clash of Clans collected tens of millions of views this year.
The infographic, based on Apptopia data, mentions the top mobile games by downloads and cash register for the year. The most downloaded game was Helix Jump. She has 328 million installations. Monster Strike is ahead of everyone in terms of revenue. The Japanese battler generated $691 million.
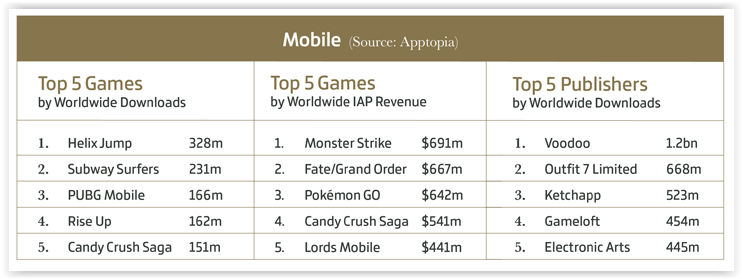
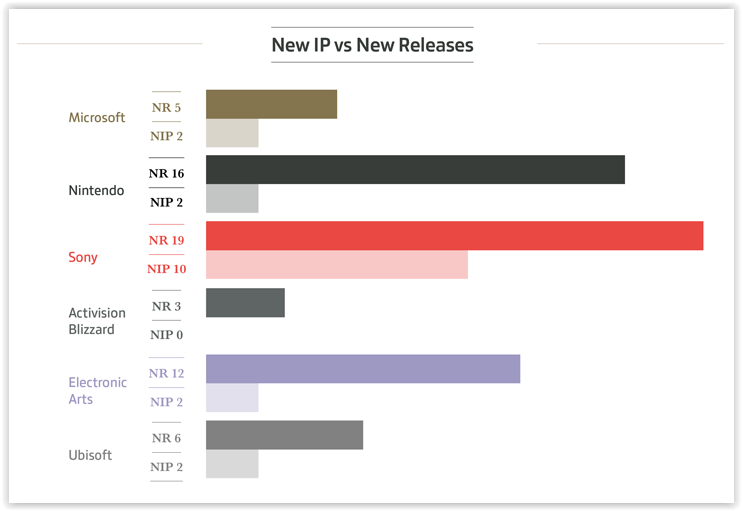
In terms of the number of new releases and the number of games on new IP in 2018, Sony was ahead of everyone. The company has released 19 games, 10 of which are new brands. That’s a lot. The number of fresh IP addresses from other market leaders, as a rule, did not exceed two.
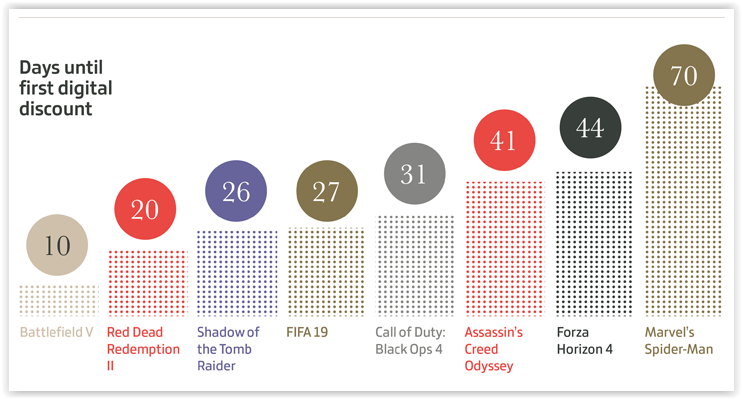
It was also calculated how many days passed between the releases of major games and the first discount on them. The fastest way to get rid of the price tag is Battlefiled V. He received his first discount on day 10. Marvel’s Spider-Man lasted the longest — 70 days.
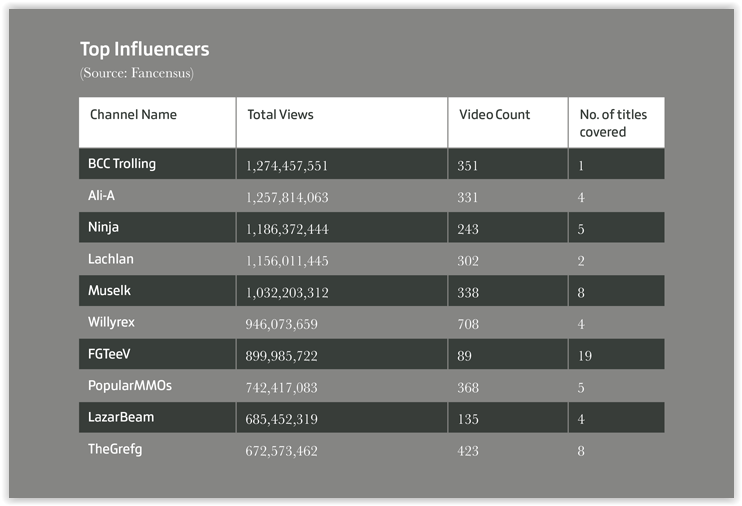
Top streamers are also indicated in the infographic. The most popular name is BCC Trolling. All of his 300-plus videos are dedicated to one game. But that didn’t stop him from gaining 1.27 billion views.
The original post with the full infographic can be found at this link.
GamesIndustry was based mainly on open data from analytical companies (Newzoo, Apptopia, ICO Partners, and so on).