The top 5 US box office games generated 28% of money and 13% of downloads of the US mobile games market in 2016.
This is reported in the report U.S. Mobile Gaming Trends: 2016 from Sega and SensorTower, which examines in detail how the market as a whole and by genre segments has changed over the past year.
Changes in the American mobile games market as a whole are devoted to this publication, written on the basis of the original document and the post of Playbeat product manager Alexander Shtachenko, who analyzed the document in detail.
The main thing
- The American mobile games market grew by 7% in 2016, earning $6.6 billion.
- The most commercially successful publisher in the USA was the company MZ. Most of her earnings came from Game of War, which earned $518.5 million in the States over the year.
- The top 5 cash games in the USA generated 28% of money and 13% of downloads of the American mobile games market.
- Original mobile IP earn more than brand games (63% vs. 37%), but the latter show much better dynamics (139% vs. 30%).
- The top earning categories are strategies, social casinos and puzzles. These three genres account for $4.3 billion of earned money.
- In 2016, the new projects released within the framework of this year performed well. They accounted for $874 million (14%) industry revenue. Most of the money was generated by Pokémon GO and Clash Royale.
- During the year, the revenues of all titles within the box office Top 200 increased.
Overall growth of the American gaming market
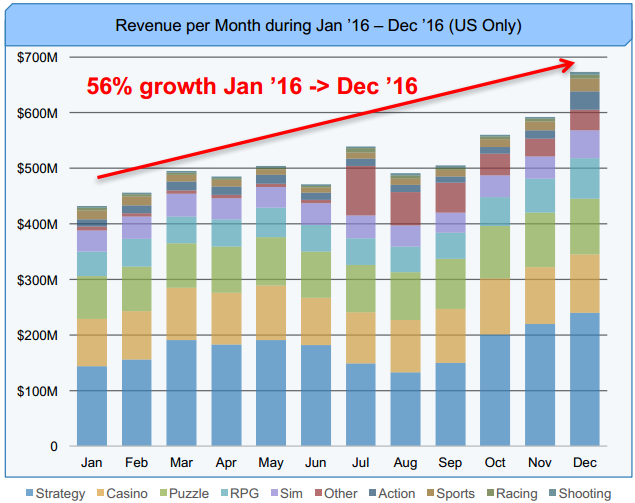
Sega emphasizes in the report that monthly earnings have grown very much over the year. If in January 2016 the industry generated $432 million, then in December – $674 million. This is a 56% increase.
Another important change: the growth of income in the “Other” category, which happened due to the appearance of the Pokémon GO game related to geolocation projects.
Shtachenko in his post notes the following:
- throughout the year, casino games consistently earned $90-$100 million;
- earnings of puzzles were also stable, the segment received an average of $70-$90 million per month.;
- role-playing games showed good growth and reached a monthly earnings of $50 million at the end of the year.
Revenue and downloads
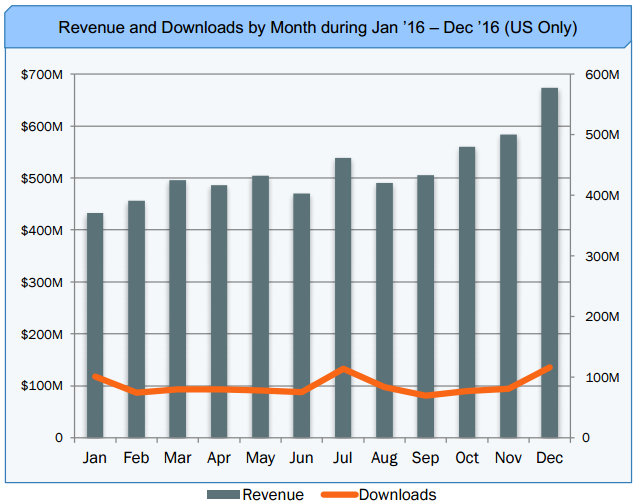
Monthly game downloads in the US have changed a lot twice in a year. The first time in the summer – after the release of Pokémon GO. Compared to June, downloads in July jumped by 51% – from 75 million to 114 million. The second time – at the end of the year in connection with the Christmas season. The number of downloads in December was 44% more than in November: 116 million vs. 80 million.
By the way, another driver of the increase in downloads in December was the release of two games: Super Mario Run and Hill Climb Racing 2. The first increased downloads of games in the Action category by 317% in December, and the second increased downloads of games in the Racing category by 173%.
Gaming trends
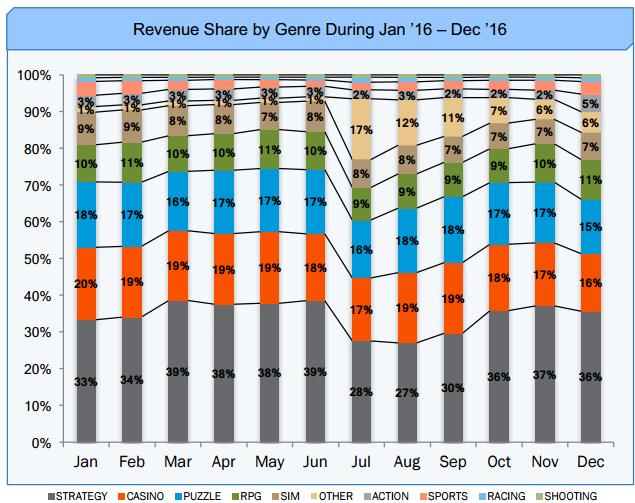
The graph duplicates in many ways the graph of general trends, which was higher. Its difference is that it shows as a percentage how much the percentage of earnings of each gaming category changed from month to month, and not in money.
This graph shows more clearly how much hits affect the share of earnings of entire categories. Pokémon GO, for example, increased the share of “Others” from 1% to 17% in July.
Platform Trends
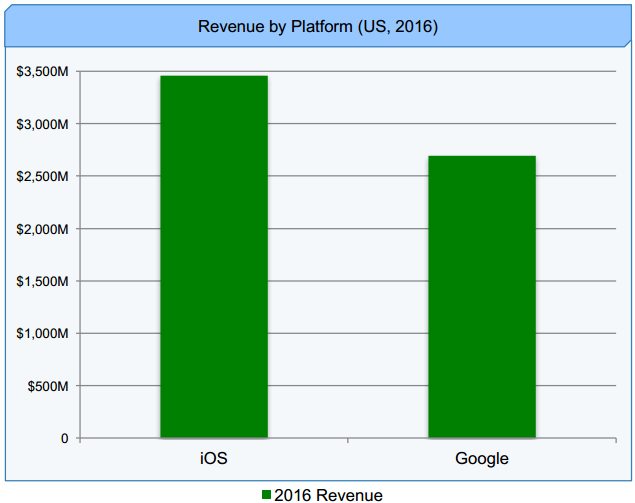
The difference in revenue from mobile games in the United States between iOS and Android is not as large as, in general, worldwide. In 2016, iOS games earned $3.5 billion, and games downloaded from Google Play – $2.7 billion.
Device Trends
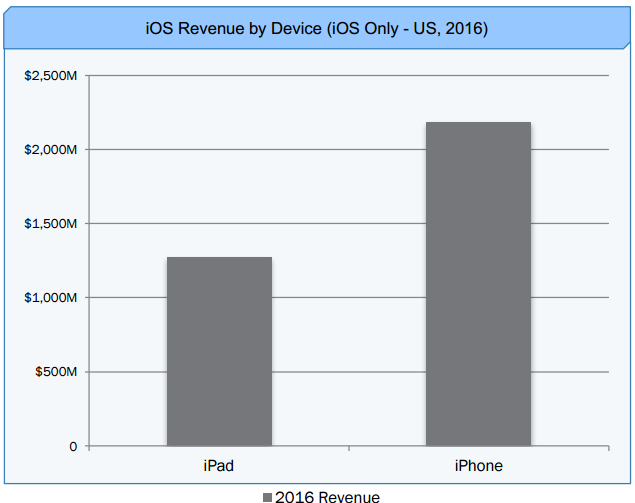
They spend more on iOS smartphones than on iPads. $2.2 billion versus $1.3 billion.
Revenue by game release time
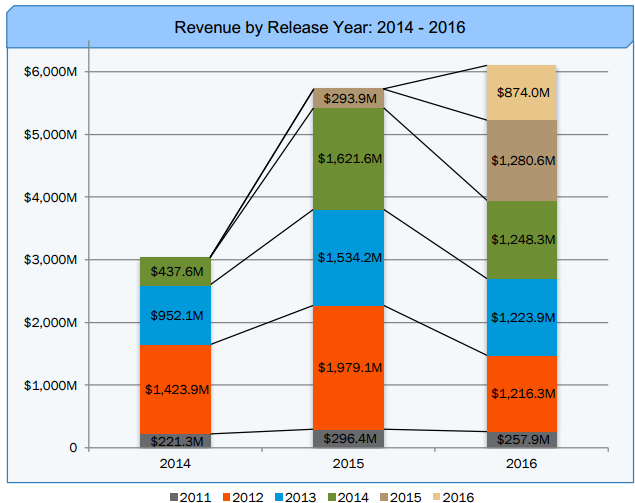
The graph shows how much the games earned depending on the year of their release.
Sega notes that in general, sales of all games released before 2015 were falling in 2016.
- The 2011 gaming segment lost 13% in revenue. Top segment games: Slotomania (46%), GSN Casino (11%) and Minecraft (11%).
- The 2012 gaming segment lost 39% in revenue. Top games of the segment: Clash of Clans (34%), Candy Crush Saga (22%) and DoubleDown Slots (10%).
- The 2013 gaming segment lost 20% in revenue. Top games of the segment: Game of War (42%), House of Fun (6%) and 8 Ball Pool (4%).
- The 2014 gaming segment lost 23% in revenue. Top segment games: Candy Crush Soda Soda (13%), Contest of Champions (9%) and Clash of Kings (8%).
But the segment of the 2015 games showed excellent results. His earnings in 2016 increased by 436%. Top games of the segment: Mobile Strike (31%), Galaxy of Heroes (6%) and Candy Crush Jelly Saga (5%).
As Shtachenko notes, in the first year of life, projects do not earn the bulk of their income on mobile. Revenue growth occurs in the 2nd year of the projects’ life: “We see this on the example of 2014 and 2015.” Plus, he notes that despite the decline in the performance of old projects, even games released in 2012 are still making excellent money.
Top 10 releases of 2016
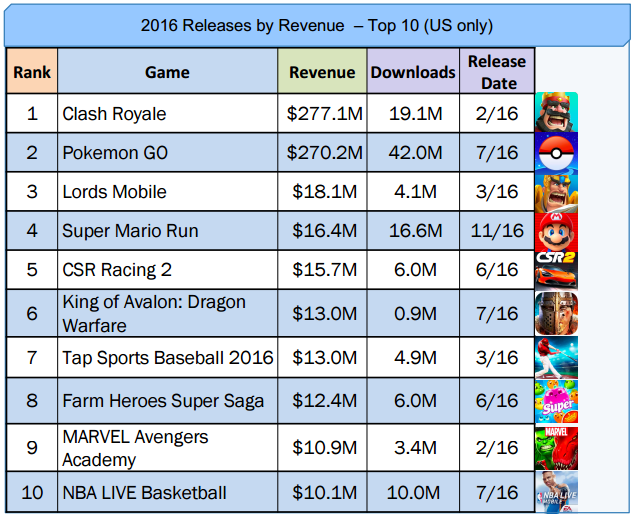
7 out of 10 games released in 2016 were made under license or are extensions of existing IP.
Two top titles released in 2016 are responsible for 83% of revenue from the entire Top 10 new releases.
Pokémon GO, despite being released in the middle of the year, is responsible for 37% of all downloads of new games.
Speaking about this table, Shtachenko emphasizes that there is not a single representative of casino games in the top of new cash games.
Distribution of revenue by publisher
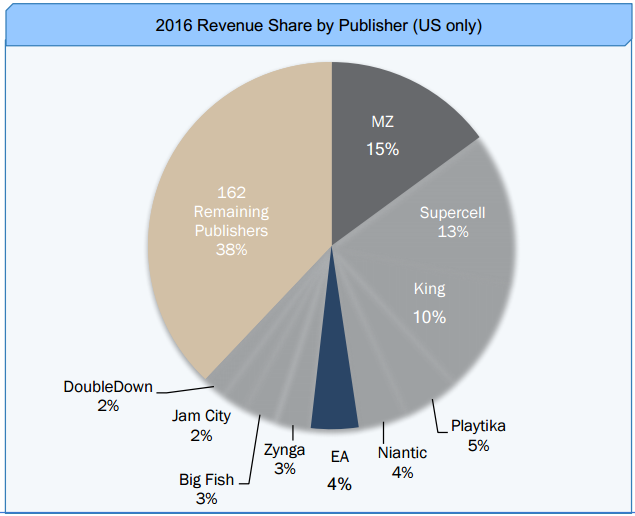
The main money players in the mobile games market in the USA are MZ, Supercell and King. The top ten also includes Jam City and Niantic.
The Top 10 publishers account for 62% of all money earned by the market.
Publishers’ income
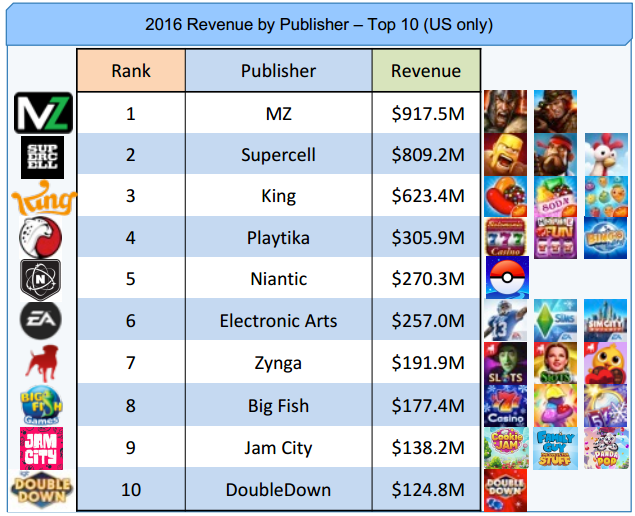
Three out of ten publishers entered the Top 10 on one or two titles,” Sega notes.
Four out of ten publishers in the Top 10 have earned their places on social casinos, – adds Shtachenko.
Brands vs. original IP
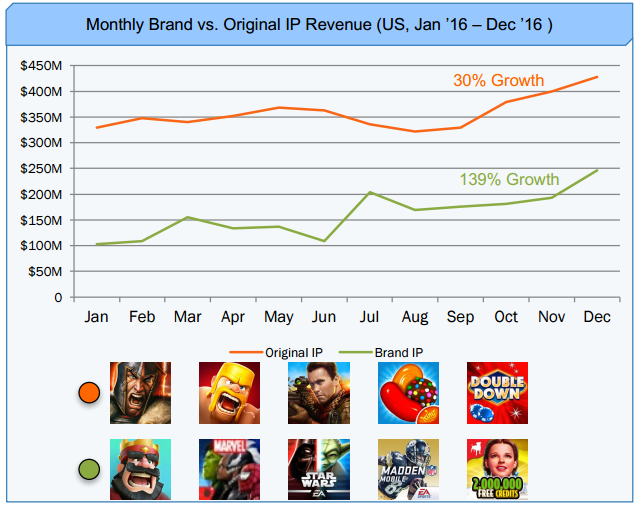
The original titles earned more games under licenses in 2016. They account for 63% of income. But at the same time, the growth rate of branded games turned out to be much higher: 139% versus 30%.
Most of the revenue of branded games came from Pokémon GO and Clash Royale.
Distribution of game revenue
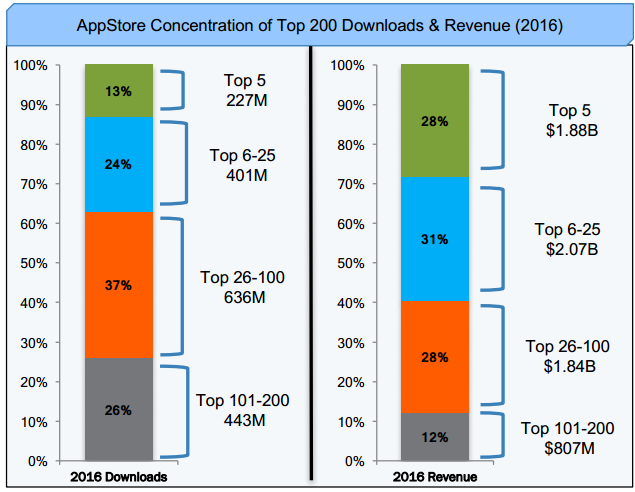
When Sega writes that the US mobile games market has generated $6.6 billion, it means that games from the box office gaming Top 200 have earned so much.
5 top projects earned almost a third of this amount. Positions from 6 to 25 accounted for another $2 billion.
As Shtachenko notes, the top 25 projects account for almost 60% of all money. However, those projects that are not in the Top 100 also earn money. They accounted for $807 million.
How much money can a game count on in a particular place in the top?
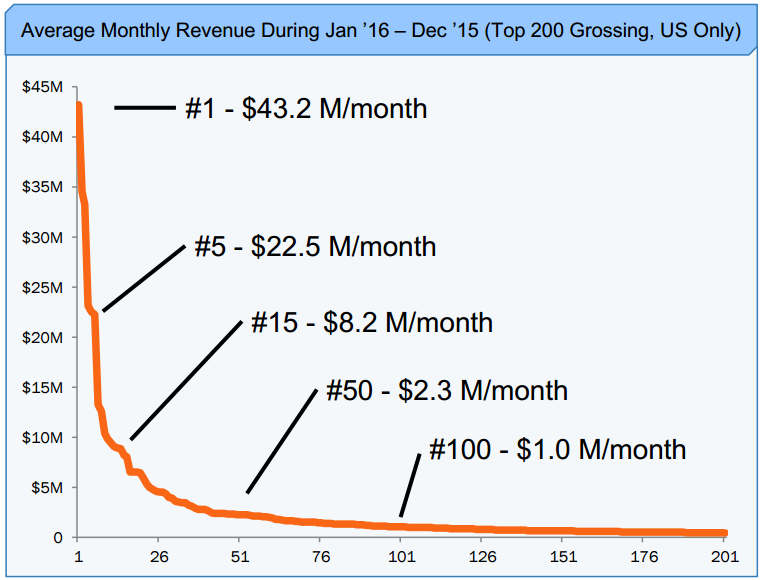
The most interesting graph in the report reflects how much a mobile game earns per month in the USA in one position or another (taking into account the position immediately in the App Store and Google Play).
Important: the indicators are growing from month to month.
Sources: U.S. Mobile Gaming Trends: 2016, progamedev.net