What the mobile games industry looks like today from the point of view of macroeconomics, the analytical company App Annie revealed in its latest report. We offer a short version in Russian.
- Games are responsible for 10% of the time that users spend working with mobile applications.
- Over the past two years, the share of time that users spend on games has increased by 50%.
- Working with messengers eats up most of the time for mobile app users. They account for 50% of the hours spent on a smartphone. Video players and content editors are in second place.
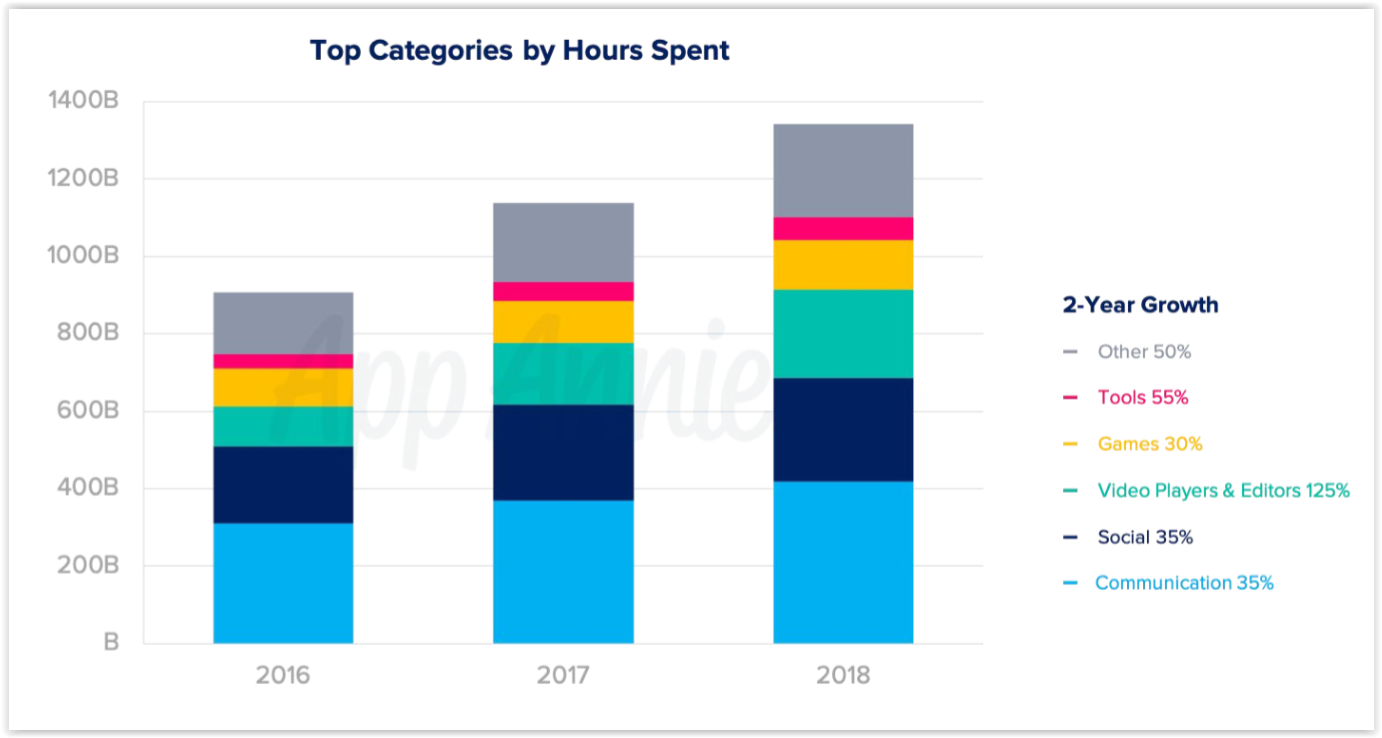
Top application categories by the number of hours spent
- On average, 8 games are installed on one mobile device in the USA.
- Users, on average, play 2-5 games monthly.
- Consumer behavior varies greatly.
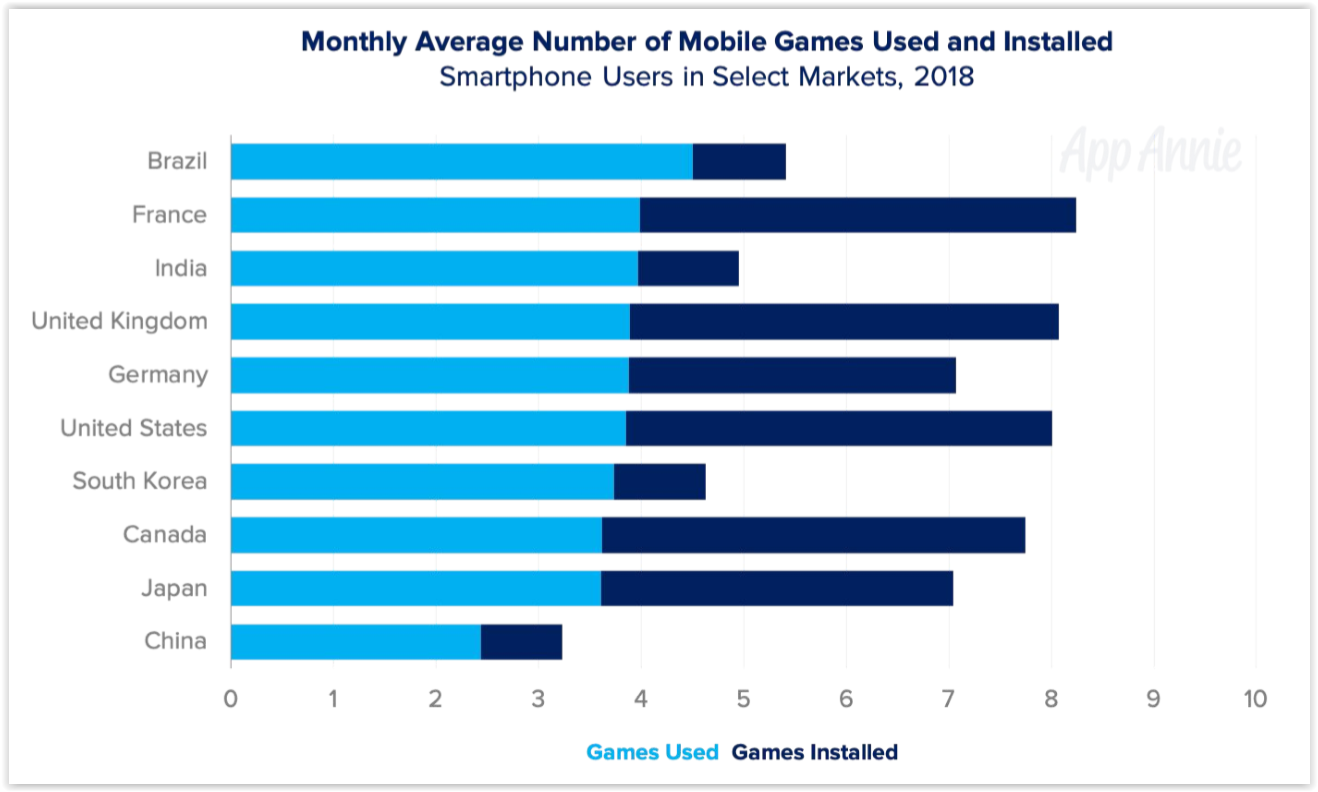
Average number of installed and used games per month
- By the end of 2018, a third of all mobile downloads (33%) were games.
- 74% of all the money that mobile users spent on apps in 2018 came from games.
- 95% of all money spent on mobile games came from in-game payments, not from premium purchases.
- The time that the mobile audience as a whole (that is, all users together) spends on games is growing by 10% from year to year. There are two main factors. The first is the increasing involvement in games among those who have been playing for years. The second is an increase in the mobile audience as a whole.
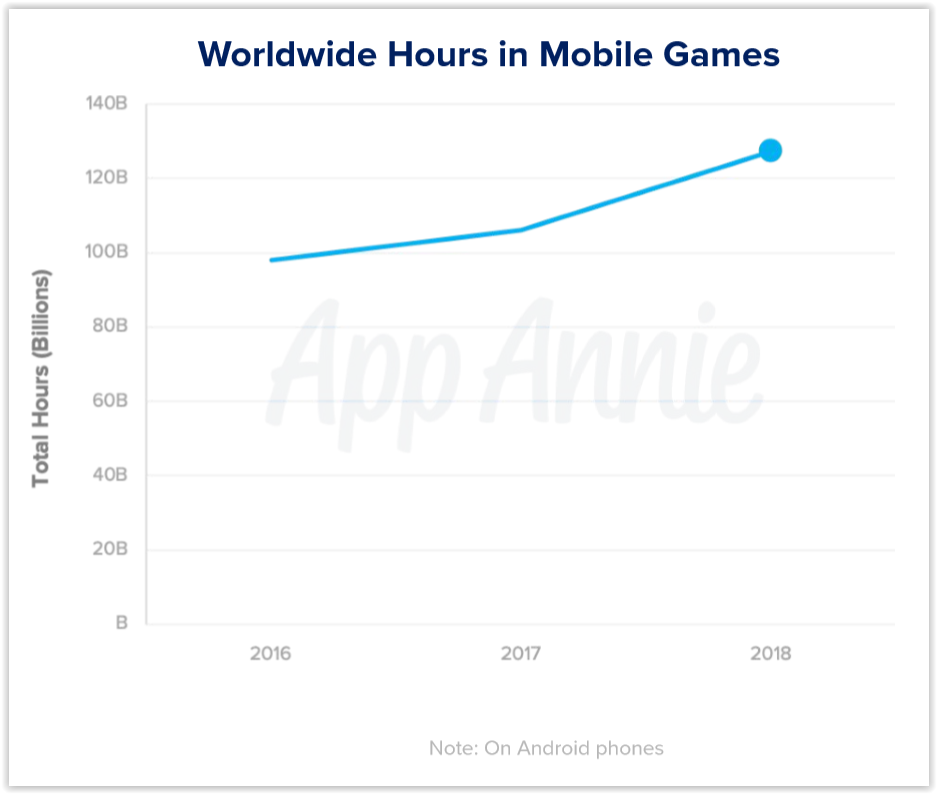
The number of hours spent on mobile games in the world
- Of all the time that users spend on games, most of it fell on an audience over 25 years old. Simply put, out of 100% of the time that all of humanity spent on mobile games, about 75% were adults.
- The ratio varies from country to country, but, as a rule, the older audience spends more time playing games in total. The only exception is China, where those aged 16 to 24 and those over 25 spent about the same number of hours at the games in 2018.
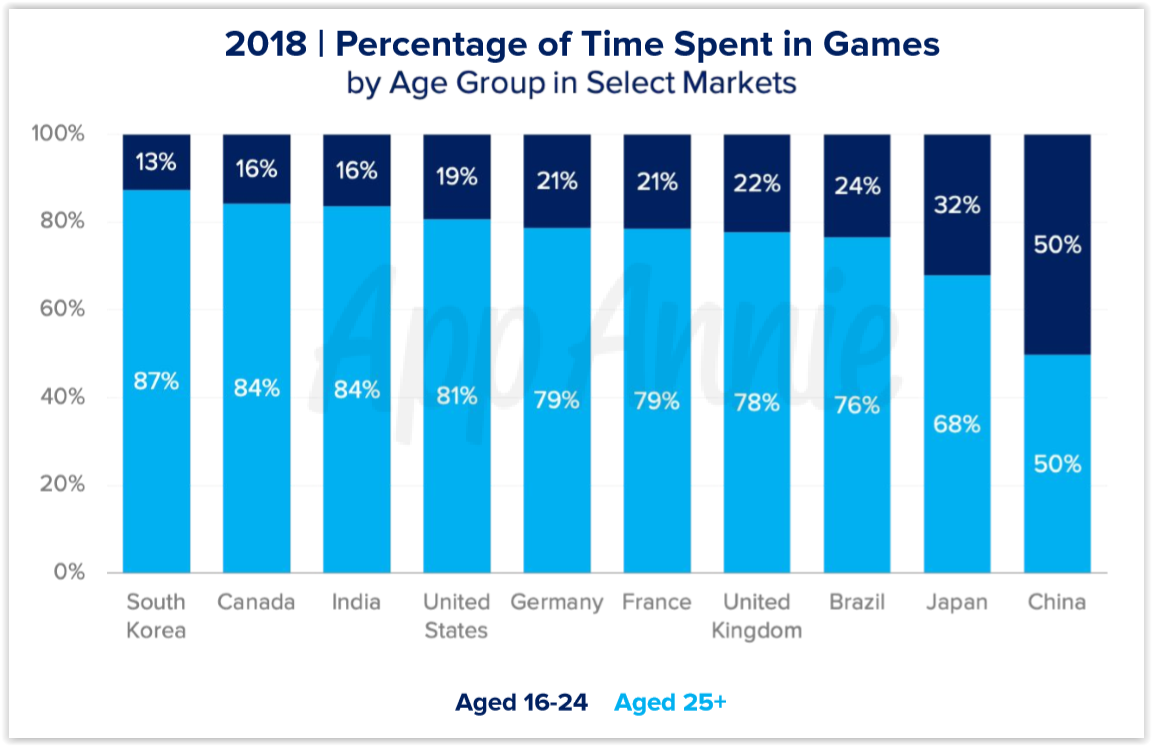
The amount of time spent in games, segmented by age and country
- About 1.6 million games were released on Google Play last year.
- Last year, about 1.1 million games were released in the App Store.
- Most of the world’s downloads — 72% — are still on Google Play.
- The majority of the global box office — 64% — is still for the App Store.
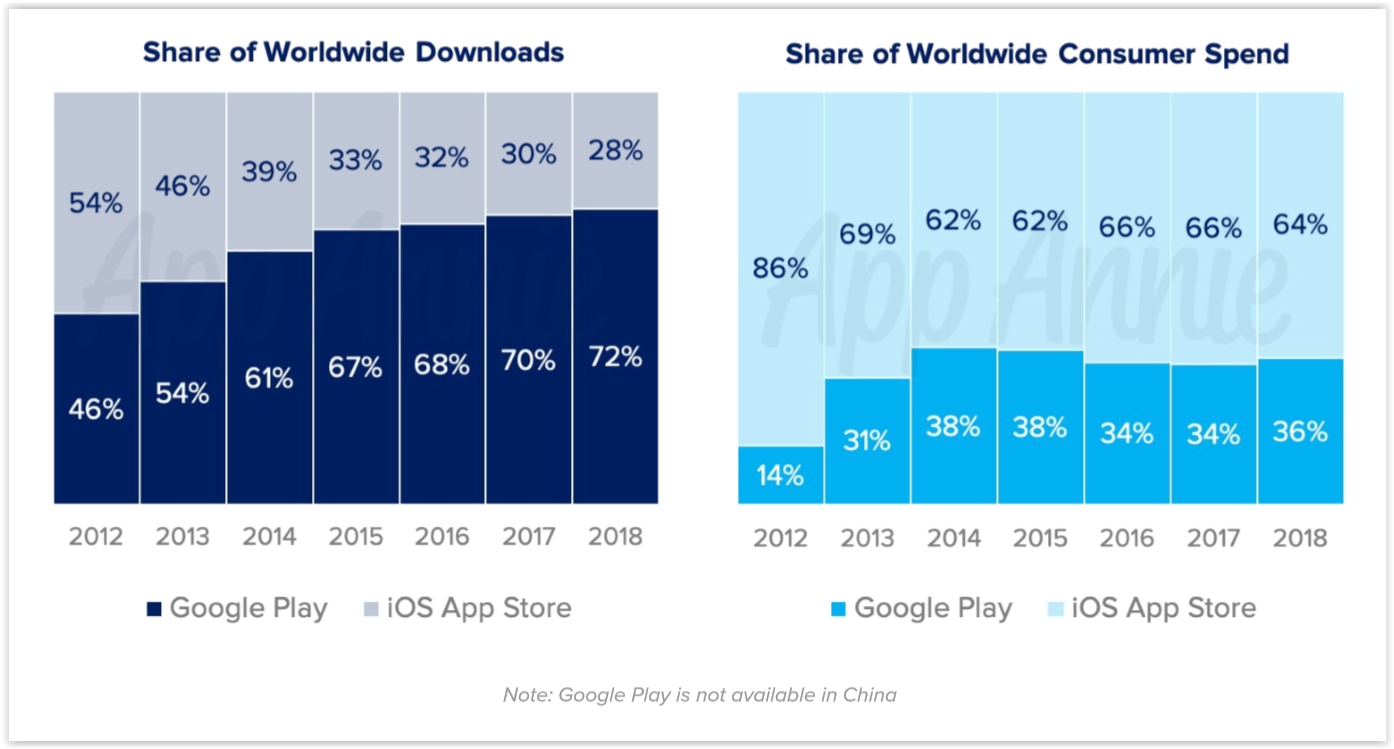
The ratio of downloads and user spending between Google Play and the App Store
- In general, 15% more money was spent on mobile games in 2018 than a year earlier.
- But the dynamics strongly depend on the genre. The earnings of racing (Racing) grew the most in 2018 – by 7.9 times. The total box office of the Adventure category projects has also increased significantly.
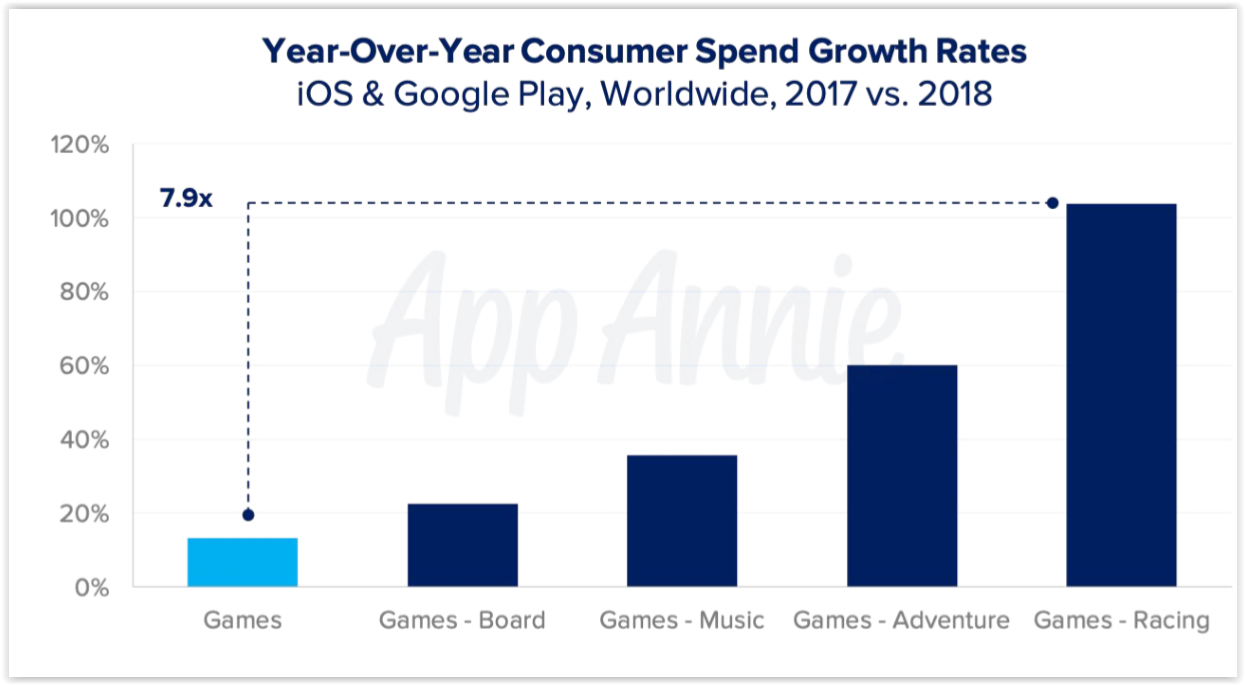
Dynamics of user spending in games (growth in 2018 relative to 2017)
- The total turnover of mobile games is more than the turnover of any other segment of the video game market. It is even 20% larger than the other segments combined.
- From year to year, the mobile games segment is also growing faster than any other.
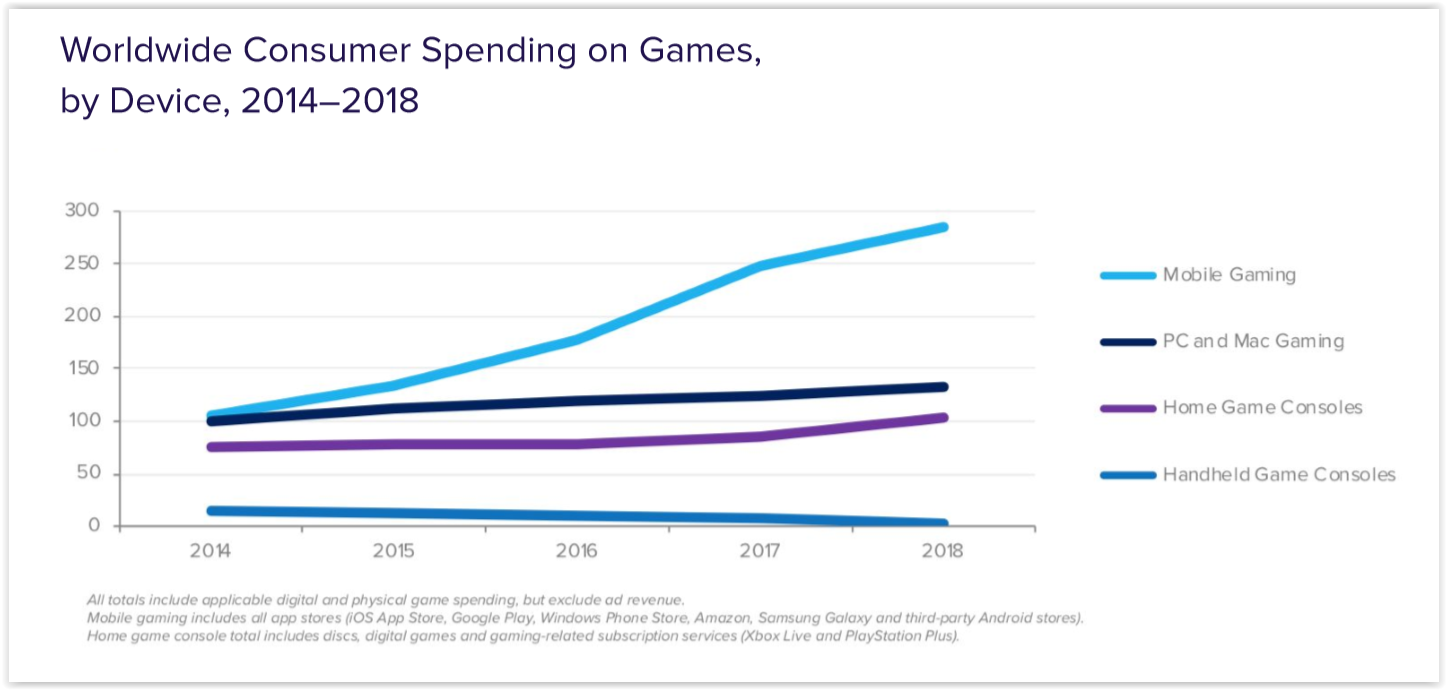
Dynamics of user spending on games (breakdown by platform)
- Among the most downloaded games of the year in 2018, cross-platform multiplayer shooters in the “battle royale” genre appeared in many countries. They began to dominate both western and eastern markets.
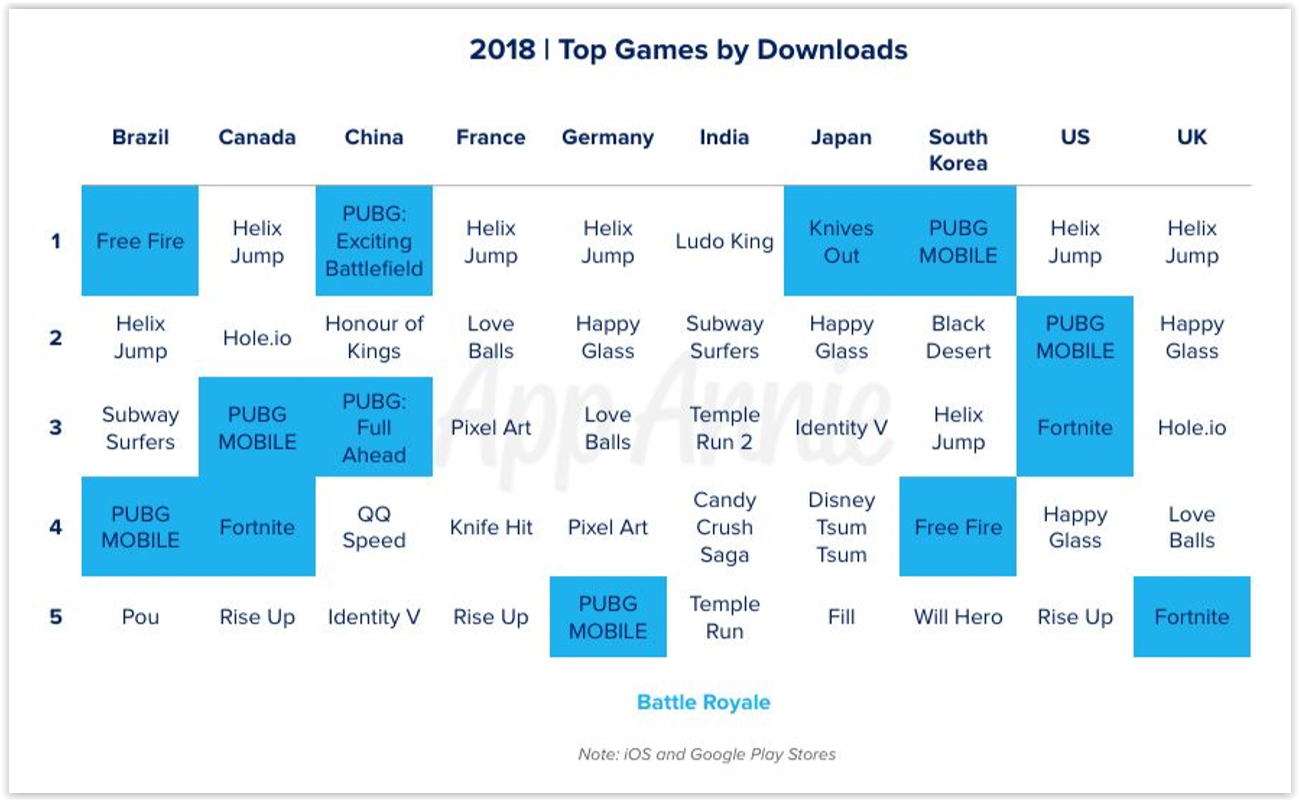
Top games by downloads in selected countries (all royal battles are highlighted in color)
- Along with shooters, hyper-casual games dominated the tops, thanks to which, according to App Annie, gaming acquired a new giant audience, whose representatives do not necessarily consider themselves gamers.
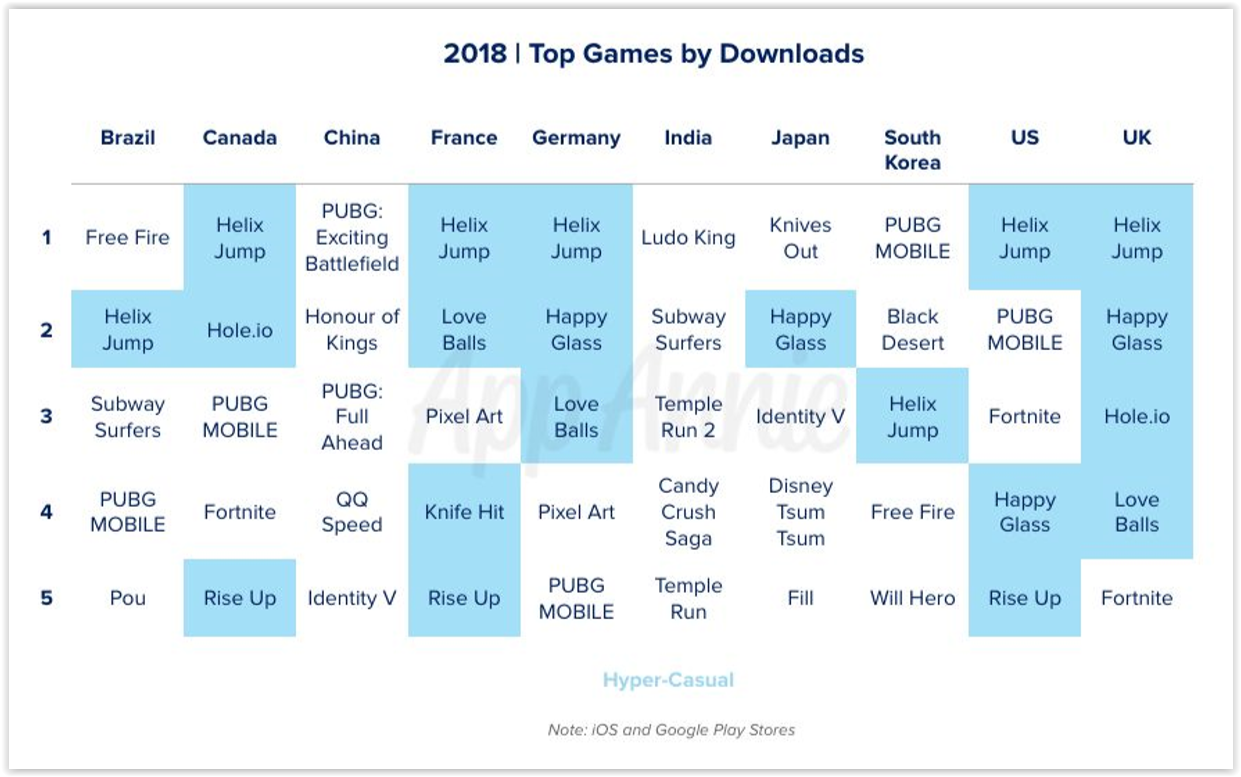
Top games by downloads in selected countries (all hyper-casual games are highlighted in color)
- The freezing of licensing in China in the second half of 2018 slowed down the growth of the Chinese market against the background of the global one.
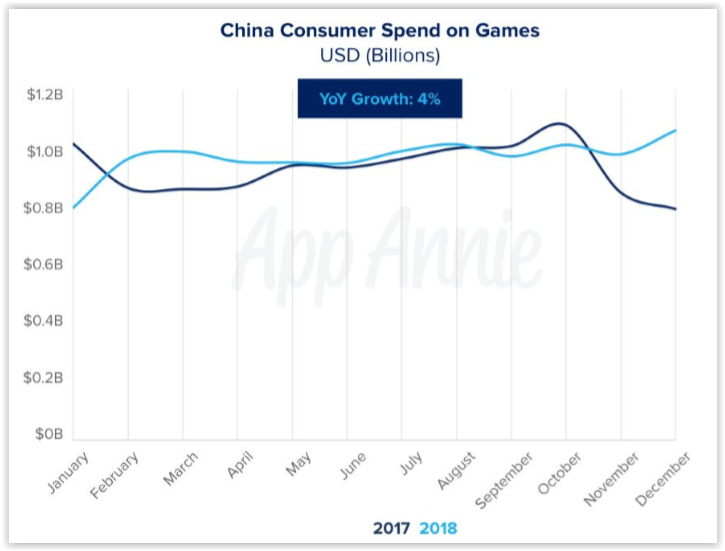
Dynamics of user spending on games in China (2017 and 2018)
- For obvious reasons, the main market of Chinese companies is China itself. However, due to the not very transparent licensing situation at home, they are now aggressively expanding into the Japanese and American markets.
- In two years, non-Chinese users’ spending on Chinese games has increased by 109%. Moreover, rapid growth was observed in all major regions (EMEA, AMER, APAC).
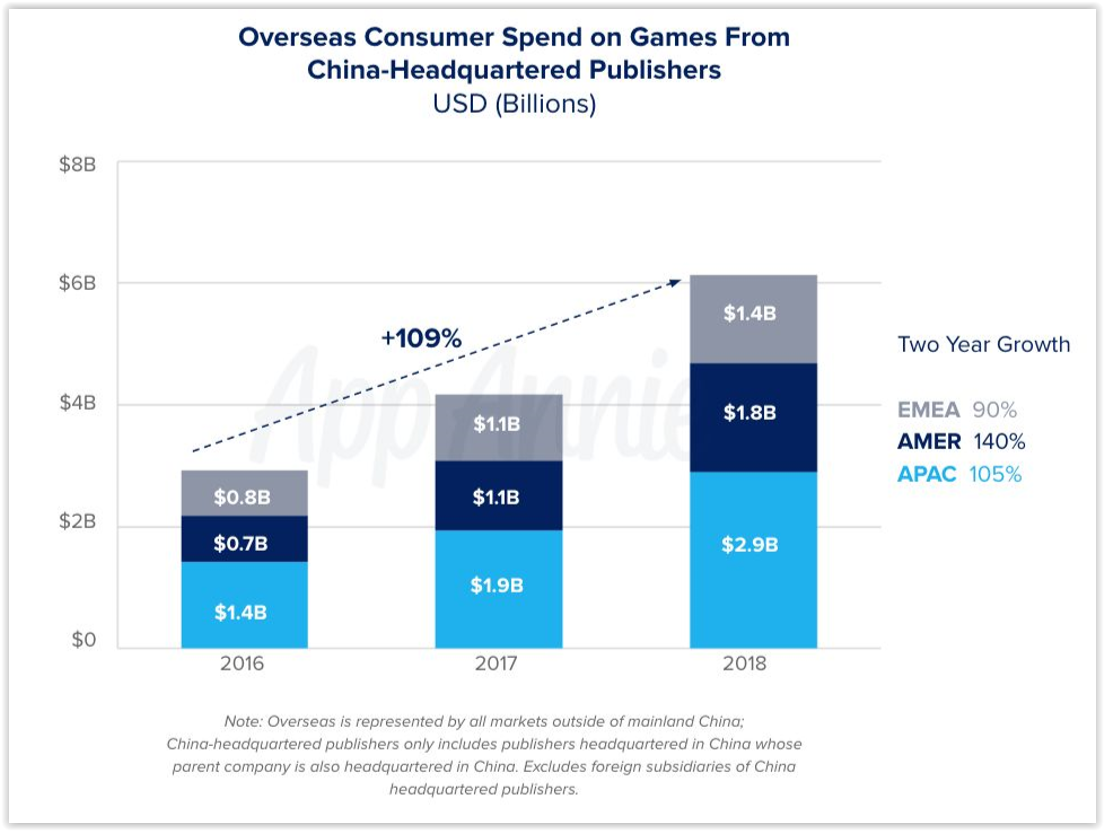
Non-Chinese users’ spending on Chinese publishers’ games (2016-2018)
- By downloads (by all categories) India is the second largest market in the world after China. The Indian market continues to grow rapidly. Over the past two years, total downloads in the region have increased by 35%. This is noticeably higher than the entire market as a whole has grown.
- The Southeast Asian market is maturing. In this regard, App Annie hopes that the high level of downloads in countries such as Indonesia, Vietnam, Thailand and others will be converted into high monetization of the region in the foreseeable future.
- The main driver of game downloads growth is emerging markets. Although among the top five countries in terms of installations, there was a place for both the USA and China.
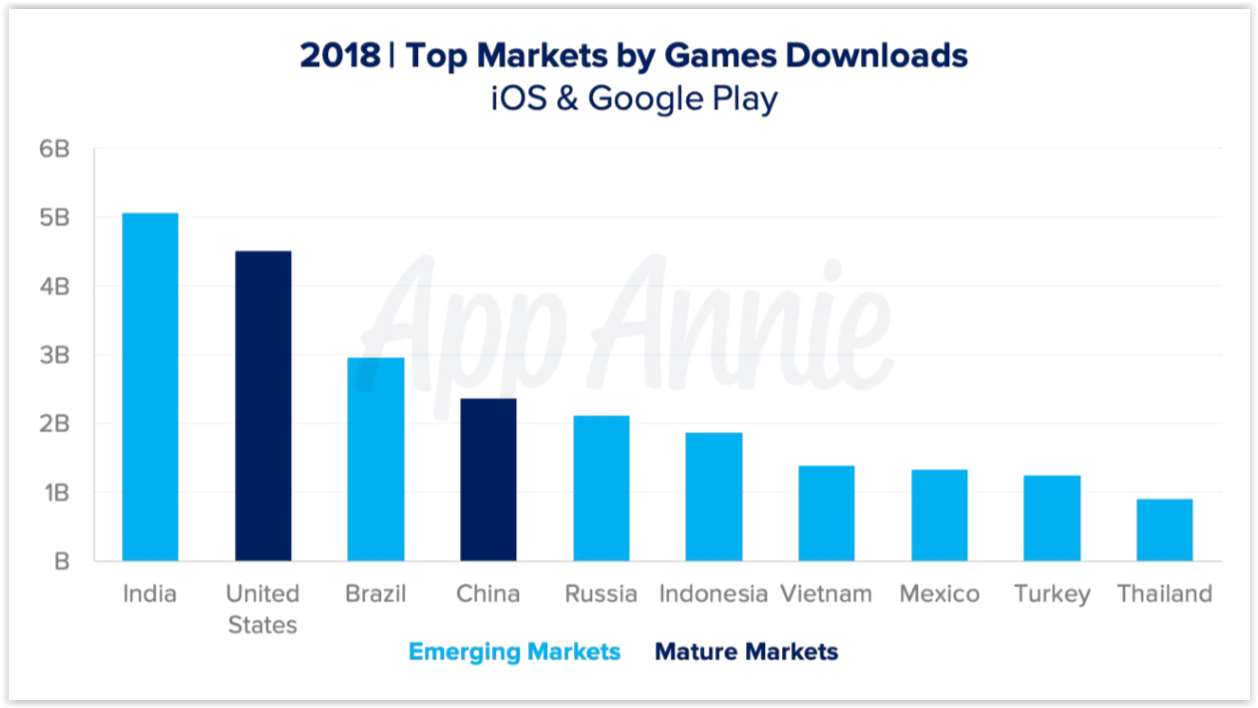
Top countries by number of game downloads
- The number of millionaire games continues to grow. If there were 1200 of them in 2016, then by the end of 2018 it was already 1900.
- According to analysts, the latter suggests that games no longer need to enter the top 10/20/50 to be considered successful.
- Advertising today plays an increasingly significant role in monetization and ROI calculation.
- In terms of spending on games, China leads both in turnover (almost twice ahead of the United States) and in dynamics (revenue growth over the past year was 105%). Of the major markets, only South Korea shows similar dynamics.
- The highest spending per user is in Japan. As for in the USA, it is here that hyper-casual games are especially popular.
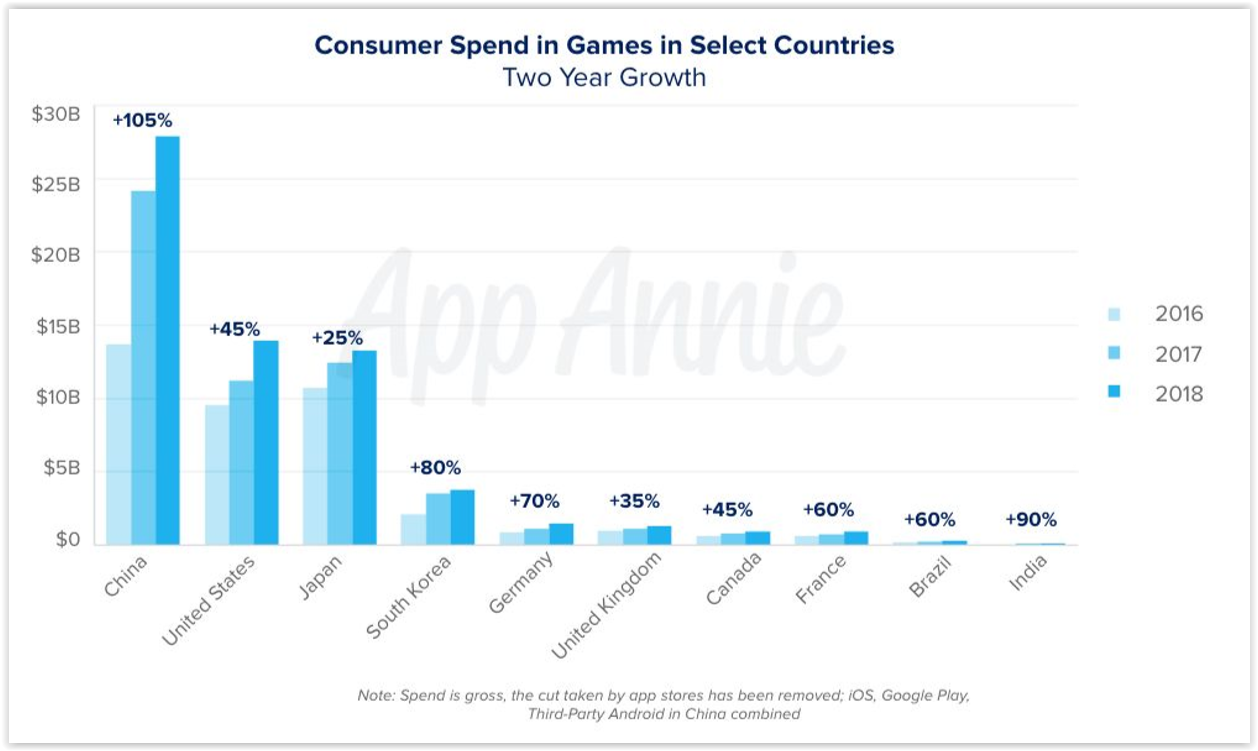
User spending on games in selected countries
- Most of the revenue comes from companies whose head offices are located in China, the USA and Japan.
- Paid advertising is responsible for 15% of all game downloads in the USA. And spending on paid installations continues to grow.
- Of the top 100 most downloaded games in the USA, only 55-65% are organic downloads, depending on the platform.
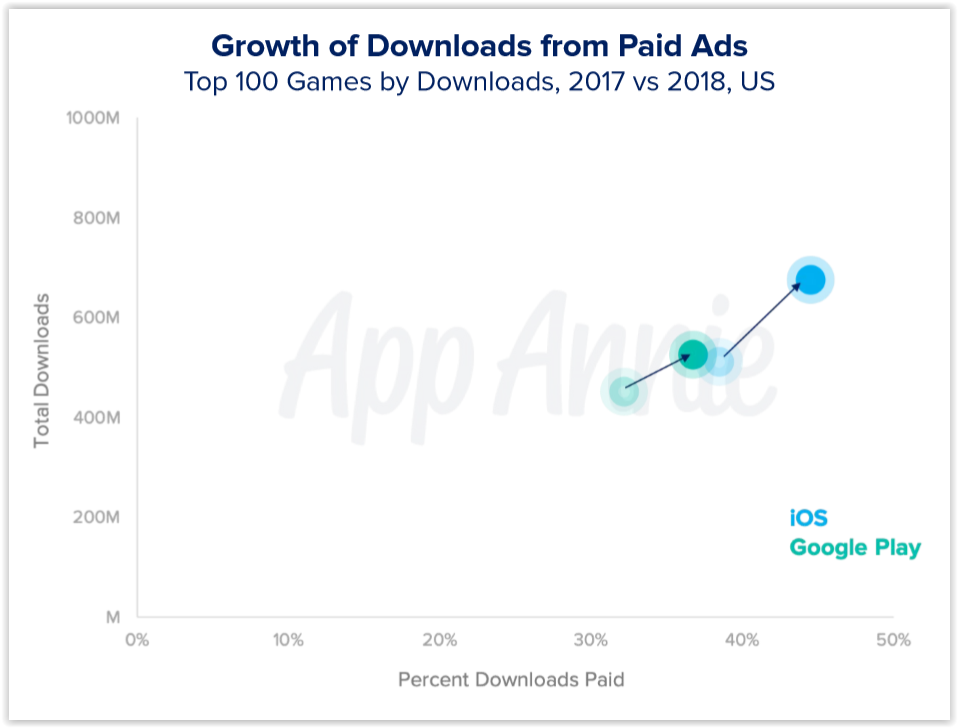
Dynamics of downloads received from paid advertising in the top 100 most downloaded games in the USA
- The number of advertising networks used at the same time is growing. If a year ago there could have been 8 of them in one application, now all 10.
- At the same time, many publishers find that if they use more than six networks within one title, they get a more profitable CPI.
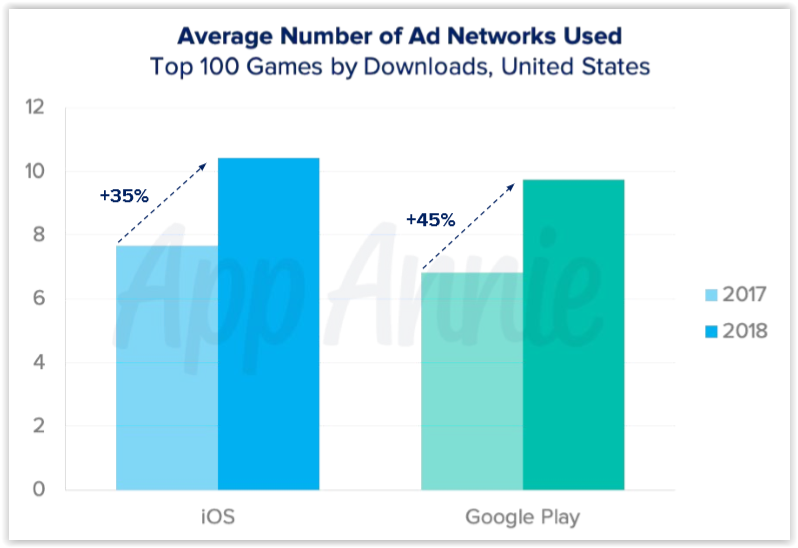
The average number of advertising networks used in the top 100 most downloaded games in the USA
Also on the topic: