On March 6, the Appodeal growth platform published an interactive report on the dynamics of eCPM over the past year. We tell you what you can learn from it.

Big remark
To begin with, eCPM is a metric that shows the revenue received by the application owner from thousands of advertising impressions made in his application.
That is, the released Appodeal report shows how much mobile app developers received on average for every thousand ads shown over the past year.
Unfortunately, there is no segmentation by application type in the report (it is impossible to find out if there is a difference in eCPM for gaming and non-gaming programs). But it allows you to track the dynamics of eCPM by country, ad format and platform.
The interactive nature of the report implies that you can use filters to highlight the market of interest and the type of advertising, and then see how eCPM changed from month to month on it.
Given such opportunities, it is clear that we would not be able to put a full story about changes in advertising revenue in the format of an article (by no means interactive). So let’s focus on showing the dynamics of eCPM in the USA.
Rewarded advertising
On iOS and Android, eCPM rewarding advertising in 2022 had a common pattern of behavior. In both cases, by the end of the year, it was possible to talk about a decrease in the effective cost of a thousand impressions. It was especially noticeable on Android, where eCPM fell by $6.12 (from $24.48 to $18.36).
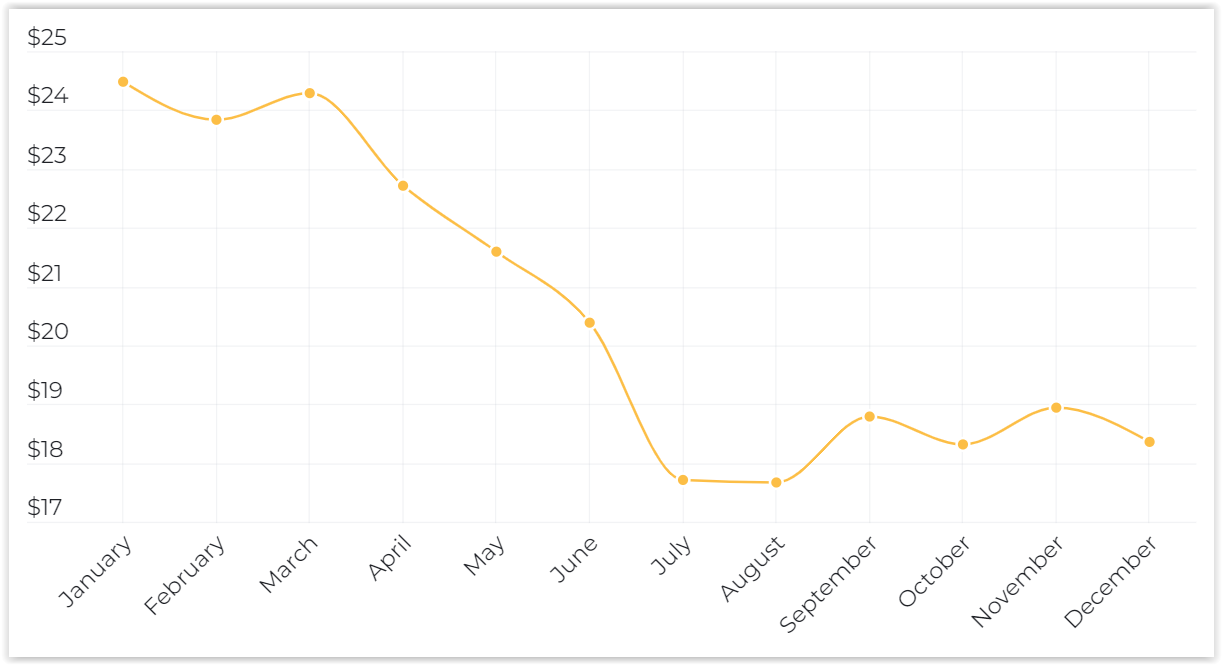
Android — Rewarded — US
On iOS, the metric also dropped to values below $20 throughout the year, but by the end of 2022, the drop was only $1.21 (from $22.7 at the beginning of the period to $21.49 at its end).
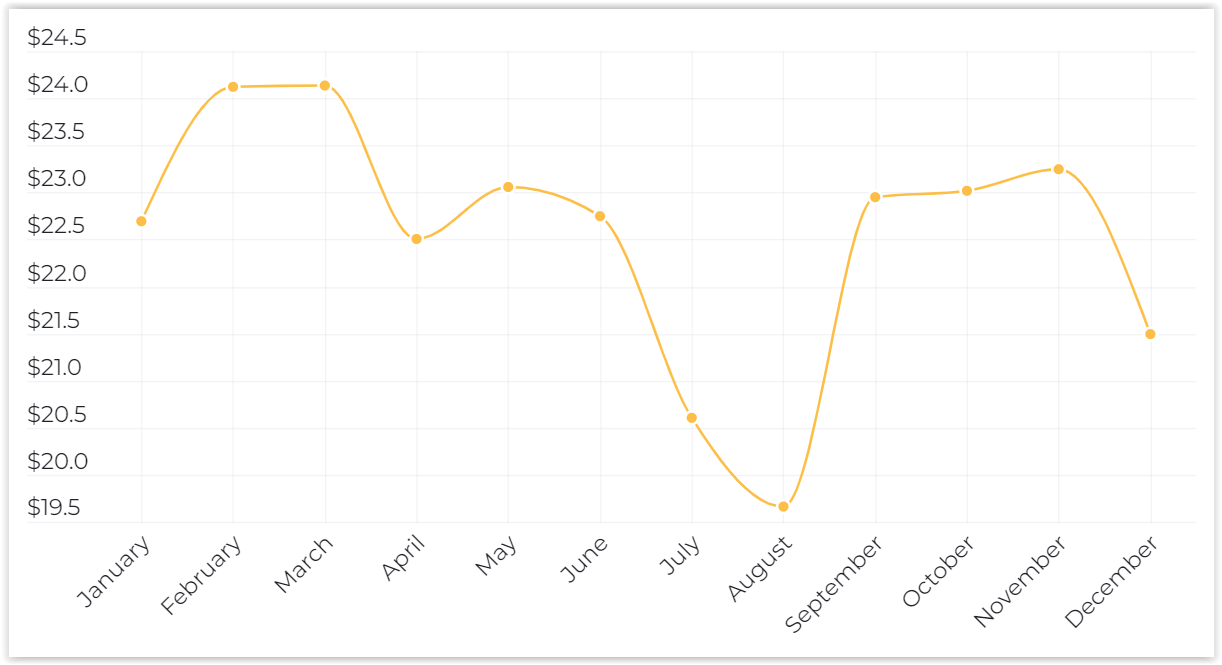
iOS — Rewarded — US
It is important to understand that eCPM fluctuations are individual for each region.
Therefore, despite the fact that, in general, the eCPM level (not only in terms of rewarding advertising, but in general) is higher in the USA than anywhere else, at the moment (during recessions at home and peaks in other countries) the situation was changing.
For example, on iOS in April, the Australian eCPM ($22.28) was on the same level as the American eCPM of rewarding advertising, in August the same situation developed relative to the eCPM in South Korea ($19.6), and in October the Taiwanese eCPM was larger than the American one ($23.4 versus $23.02).
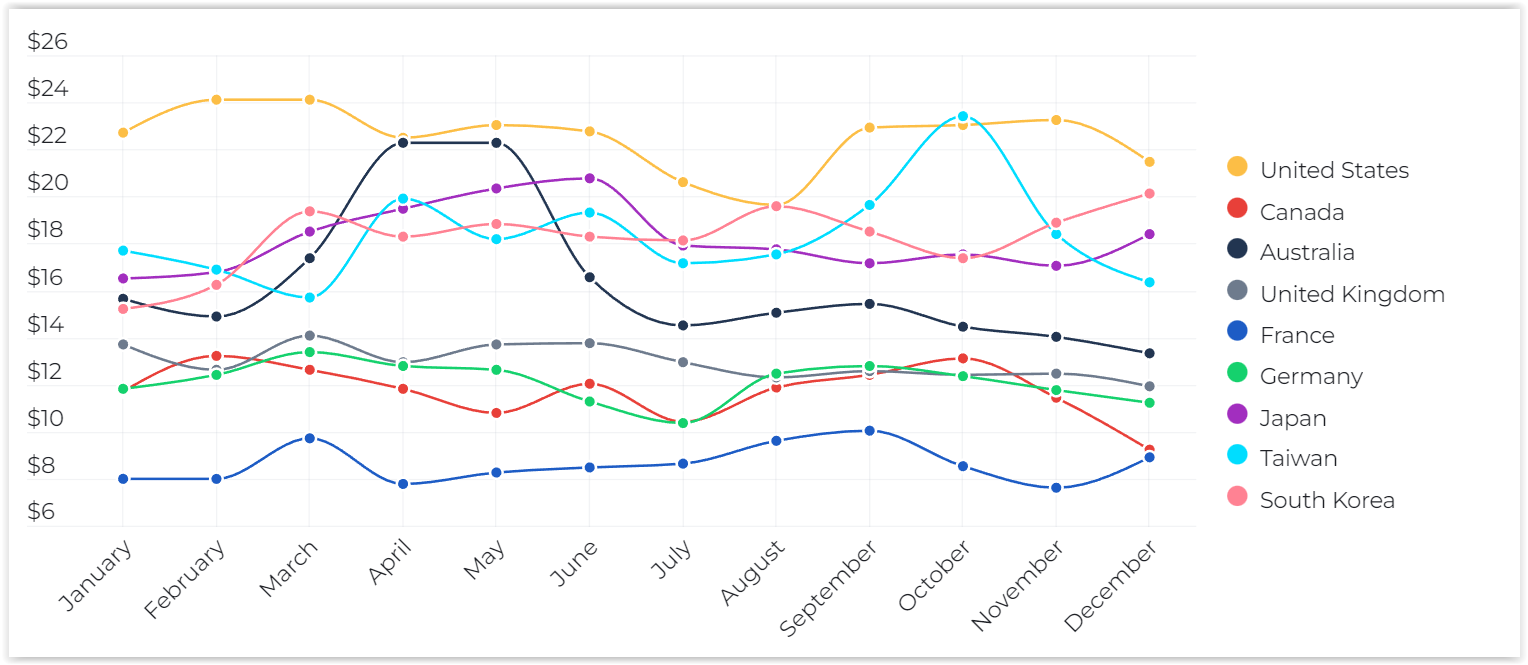
iOS — Rewarded — World — Mature
There were fluctuations on Android as well.
However, the American eCPM was consistently leading there. It also seems important to note that at the end of 2022, the top 4 leading countries in eCPM of rewarding advertising were common to both platforms. These are, in addition to the United States, South Korea, Taiwan and Japan.
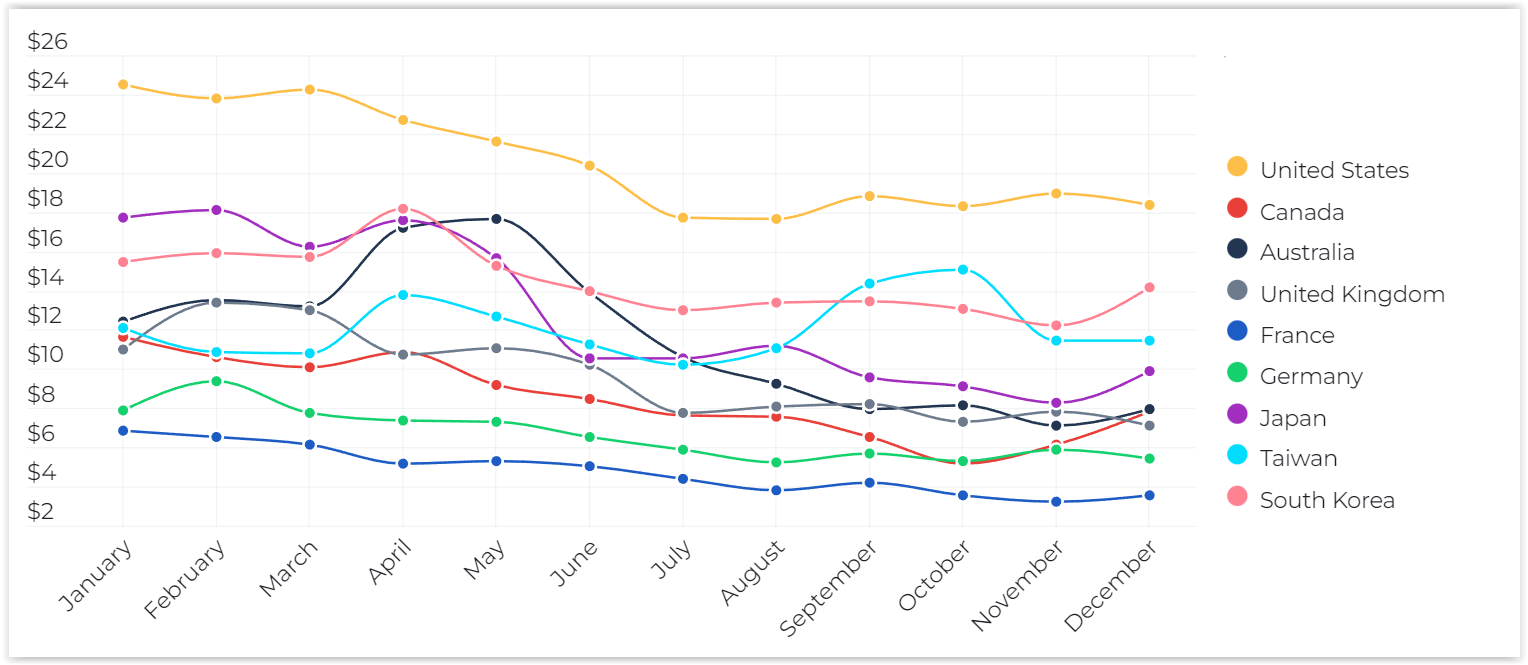
Android — Rewarded — World — MatureFullscreen advertising (Interstitials)
Here the situation in the context of the American market turned out to be completely different. On iOS and Android, the eCPM dynamics of fullscreen ads were not just different, which is normal, but also had the exact opposite character.
On iOS, full—screen advertising in the United States eCPM grew (at the end of the year, an increase of $2.65 was recorded – from $12.24 to $14.89).
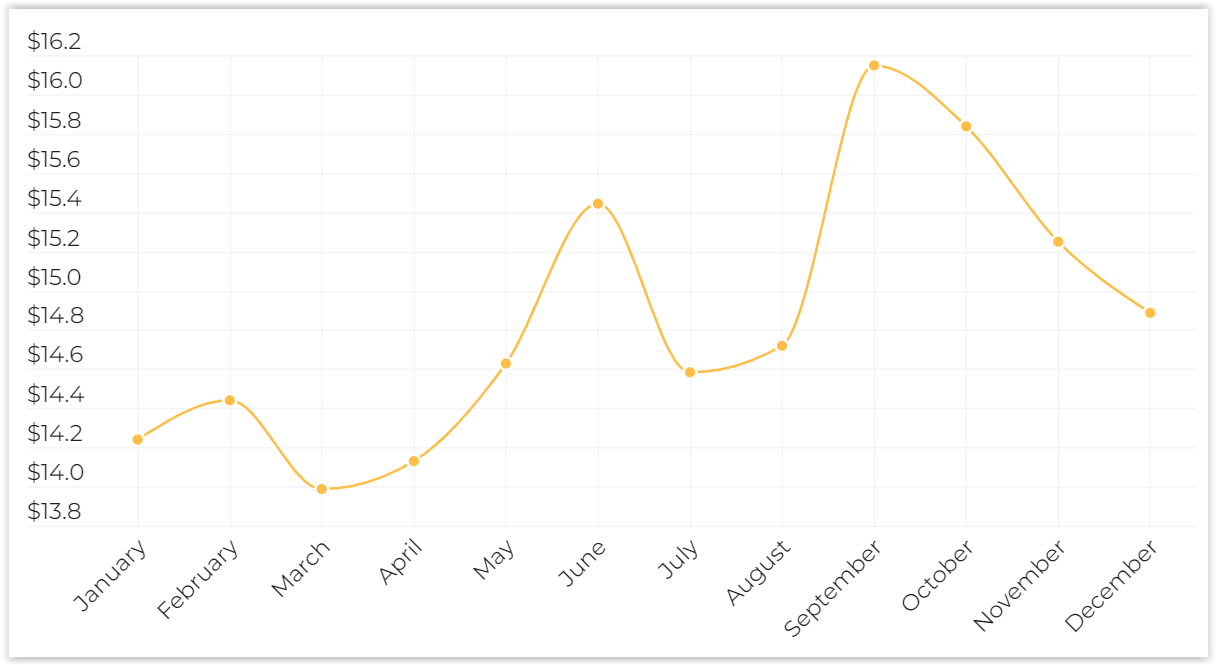
iOS — Interstitials — US
On Android, fullscreen advertising in the States had the opposite situation.
At the end of the year, eCPM fell by $1.64 (from $17.19 to $15.55).
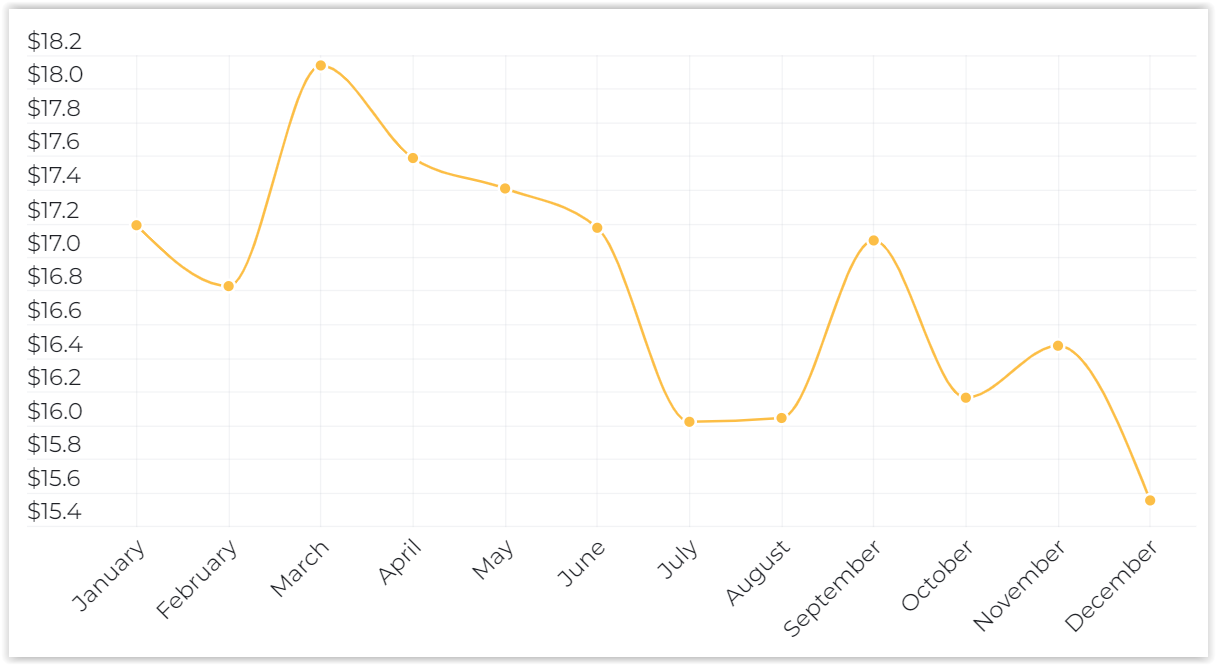
Android — Interstitials — US
At the same time, in July-August last year, eCPM had similar dynamics on both platforms.
And there, and there the indicators fell. We saw the same drop on the charts reflecting the dynamics of the American eCPM in rewarding advertising.
As for the global dynamics of eCPM full-screen advertising, significant fluctuations were also constantly observed on iOS and Android, which, however, did not lead to significant rearrangements of the eCPM leading countries.
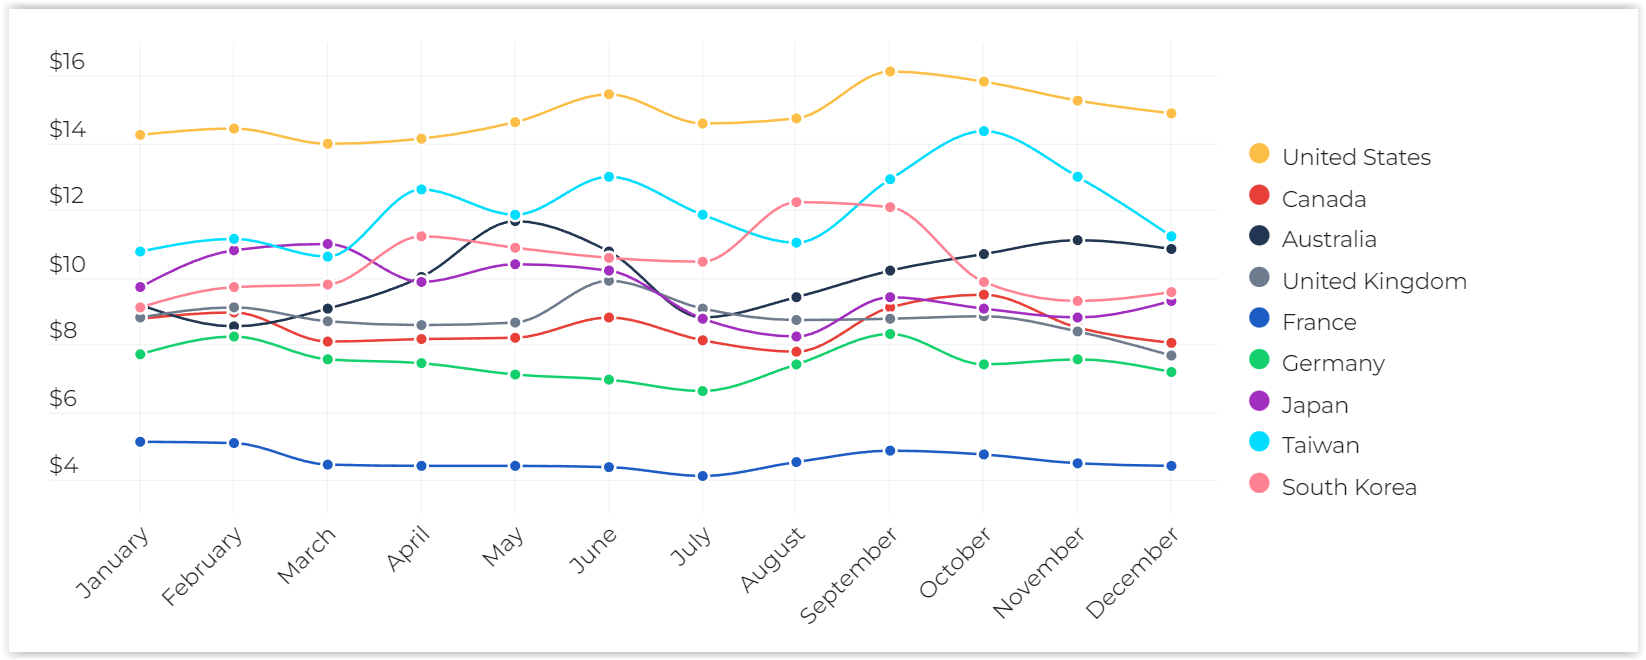
iOS — Interstitials — World — Mature
Except that Canada and Australia competed more actively for a “place in the sun”, and Taiwan turned out to be less interesting for those who sell advertising inventory in their applications.
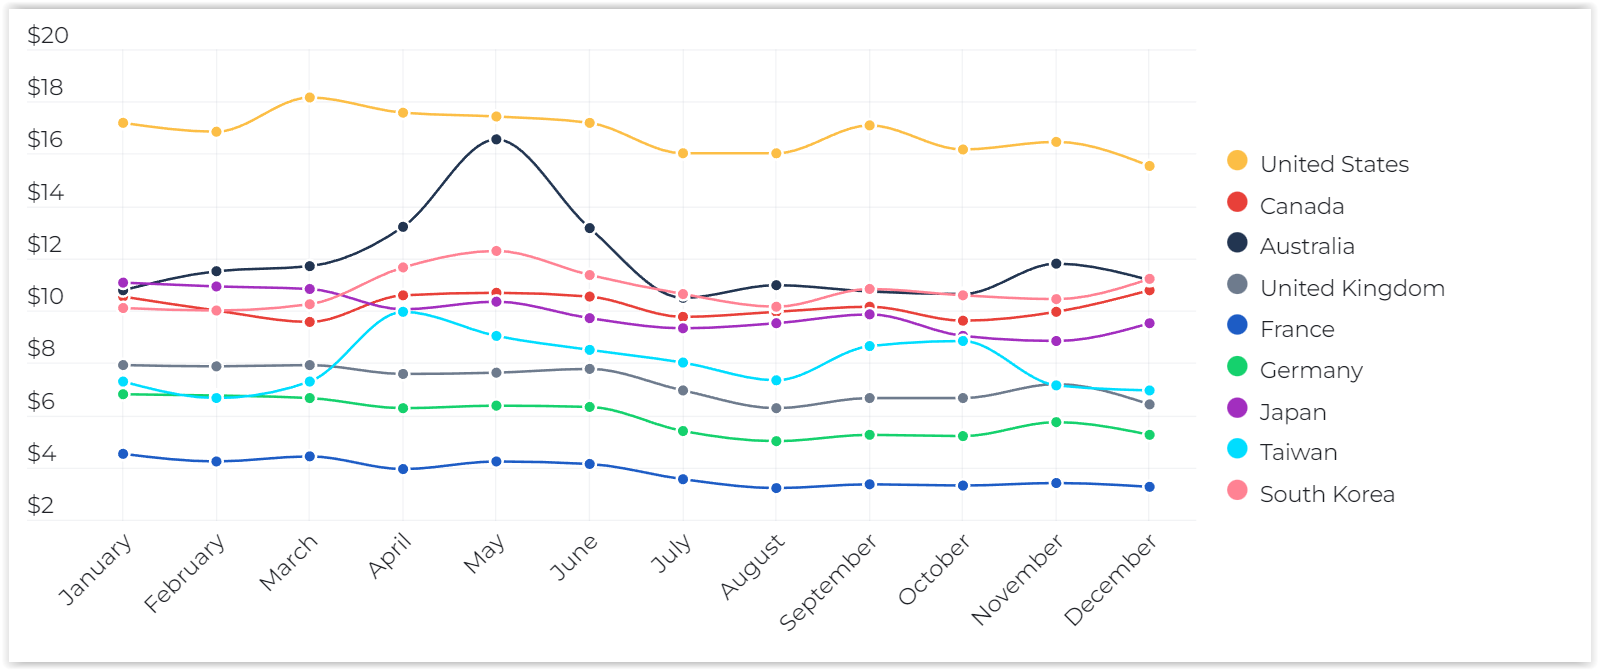
Android — Interstitials — World — MatureBanner advertising (Banners)
Despite the fact that on iOS and Android in the USA, the eCPM of banner advertising behaved differently (with a drop to a plateau of $0.36 on iOS and a jump on Android) — both there and there it grew in annual terms.
On iOS by $0.06 (from $0.34 to $0.40).
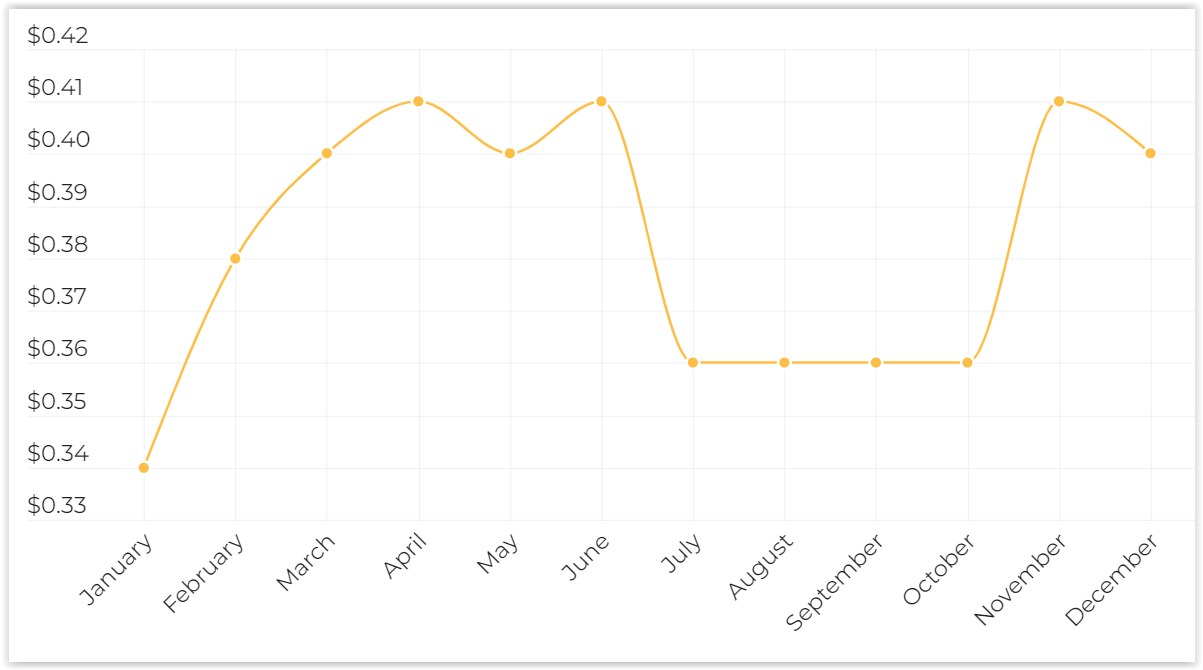
iOS — Banners— US
On Android by $0.03 (from $0.85 to $0.88).
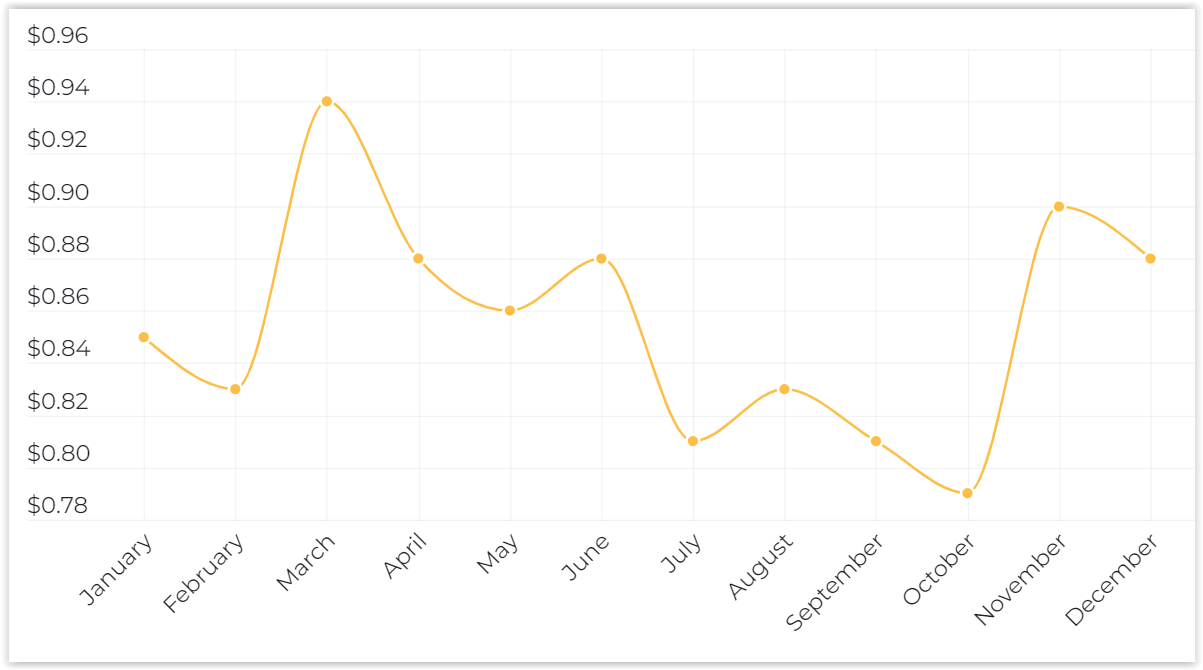
Android — Banners— US
If you look at the eCPM of banner advertising in developed countries (Mature Markets), then there are no surprises in the case of iOS and Android (the USA is in the lead, then Canada and Australia, followed by South Korea and Japan).
We don’t even see the point of bringing graphs here.
But if you look at the situation with the eCPM of banner advertising among developing countries on iOS, then there will suddenly be a rapid growth of metrics in Russia in the second half of the year (eCPM growth was in all advertising formats, but it was most clearly manifested in relation to banners).
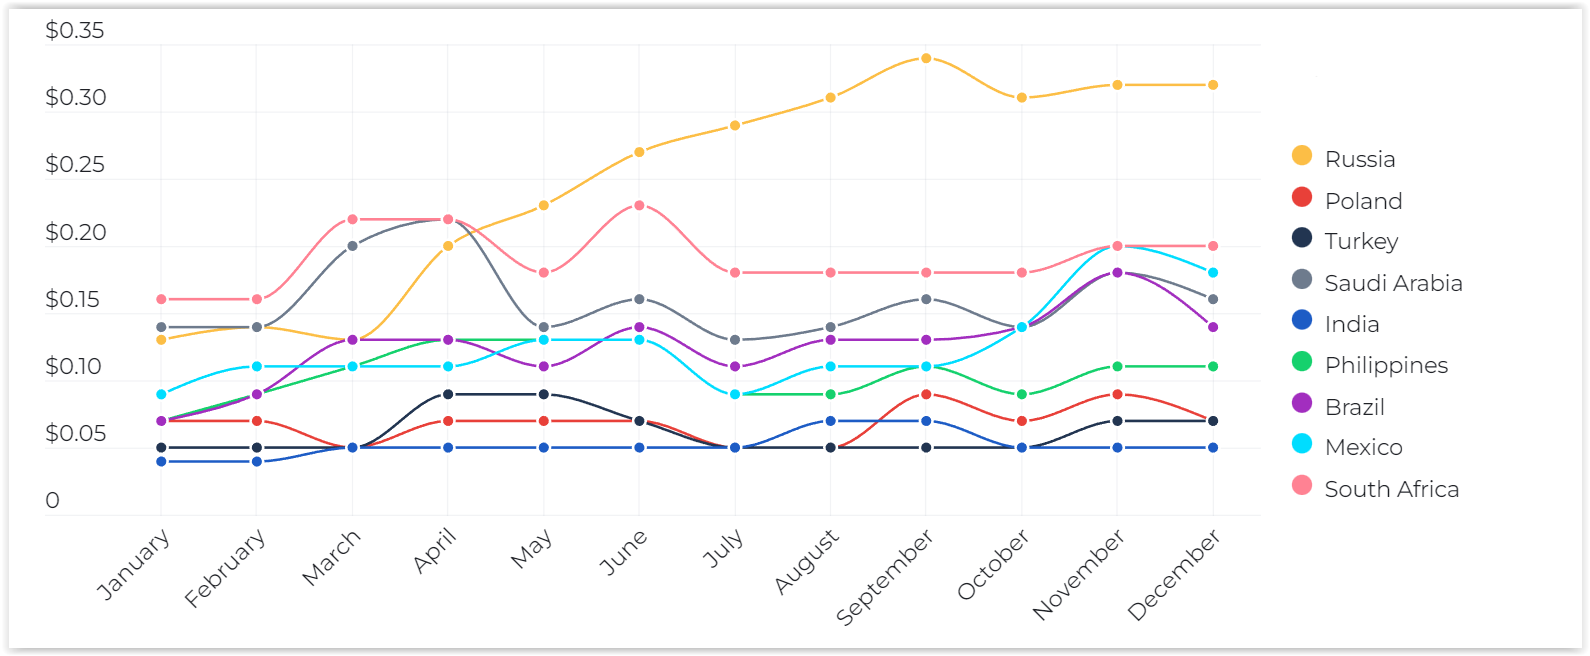
iOS — Banners — World — EmergingMethodology
The presented figures were prepared by Appodeal specialists on the basis of data obtained from 100 thousand applications, in which over 200 billion impressions were generated in total over the past year.
The full version of the report can be obtained here.