A curious toy has appeared on GitHub. It is called “Top 500 cash applications”. This is a graph that pulls up data on the position of applications in Google Play from the Droid Meter analytical resource and distributes them into six columns: the minimum number of installations, price, place in the global box office Top 500, position change (per week), rating and number of reviews.
With this tool, it is hardly possible to learn a lot about the market, but you can draw parallels between the most profitable Google Play applications.
For example, the top 25 cash register applications combine:
- Most of them have at least 10 million downloads;
- They are distributed free of charge;
- Their positions in the box office top change little during the week;
- Their average rating is 4.3 points;
- Most of them have at least 500 thousand reviews.
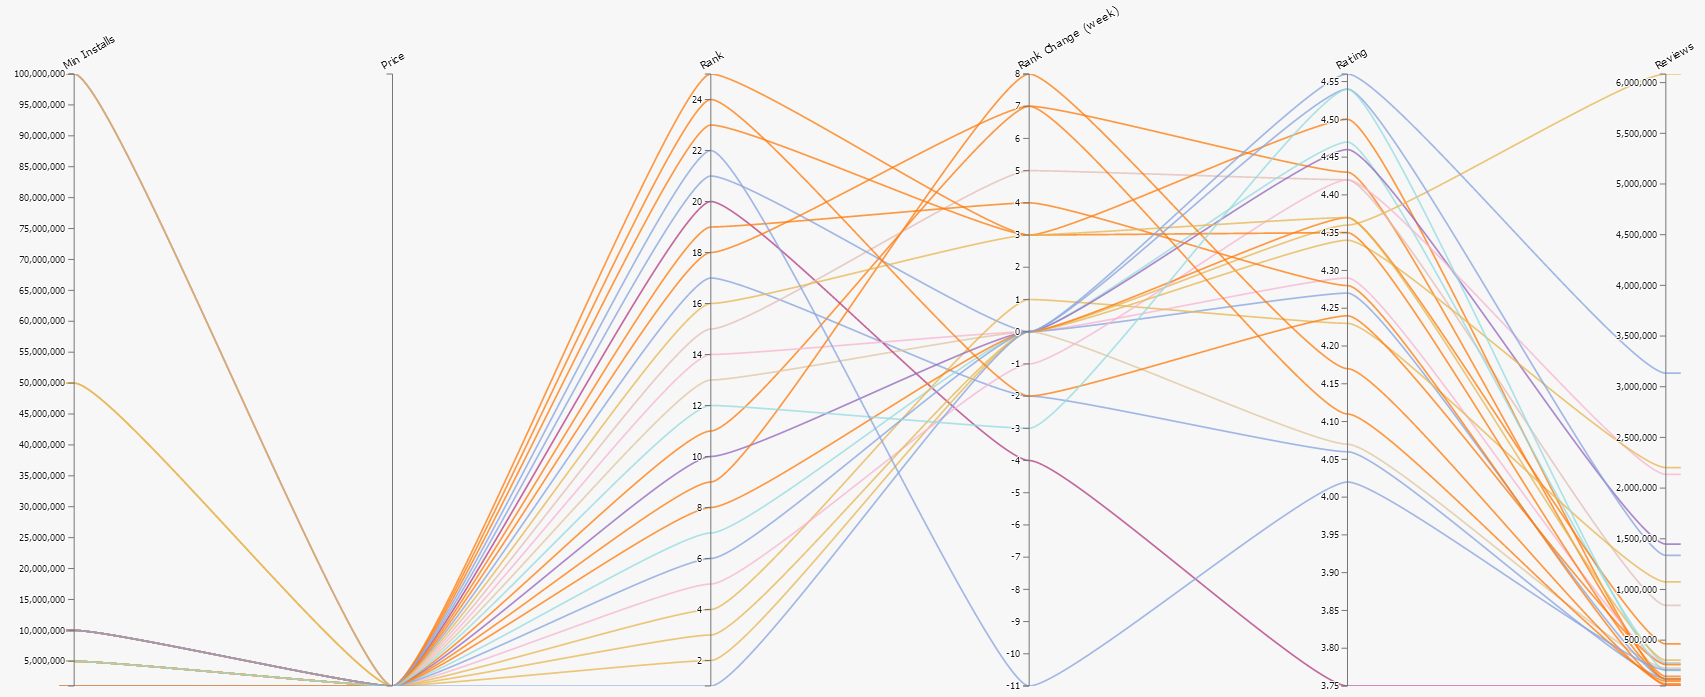
And this is what the Top 500 cash register applications look like:
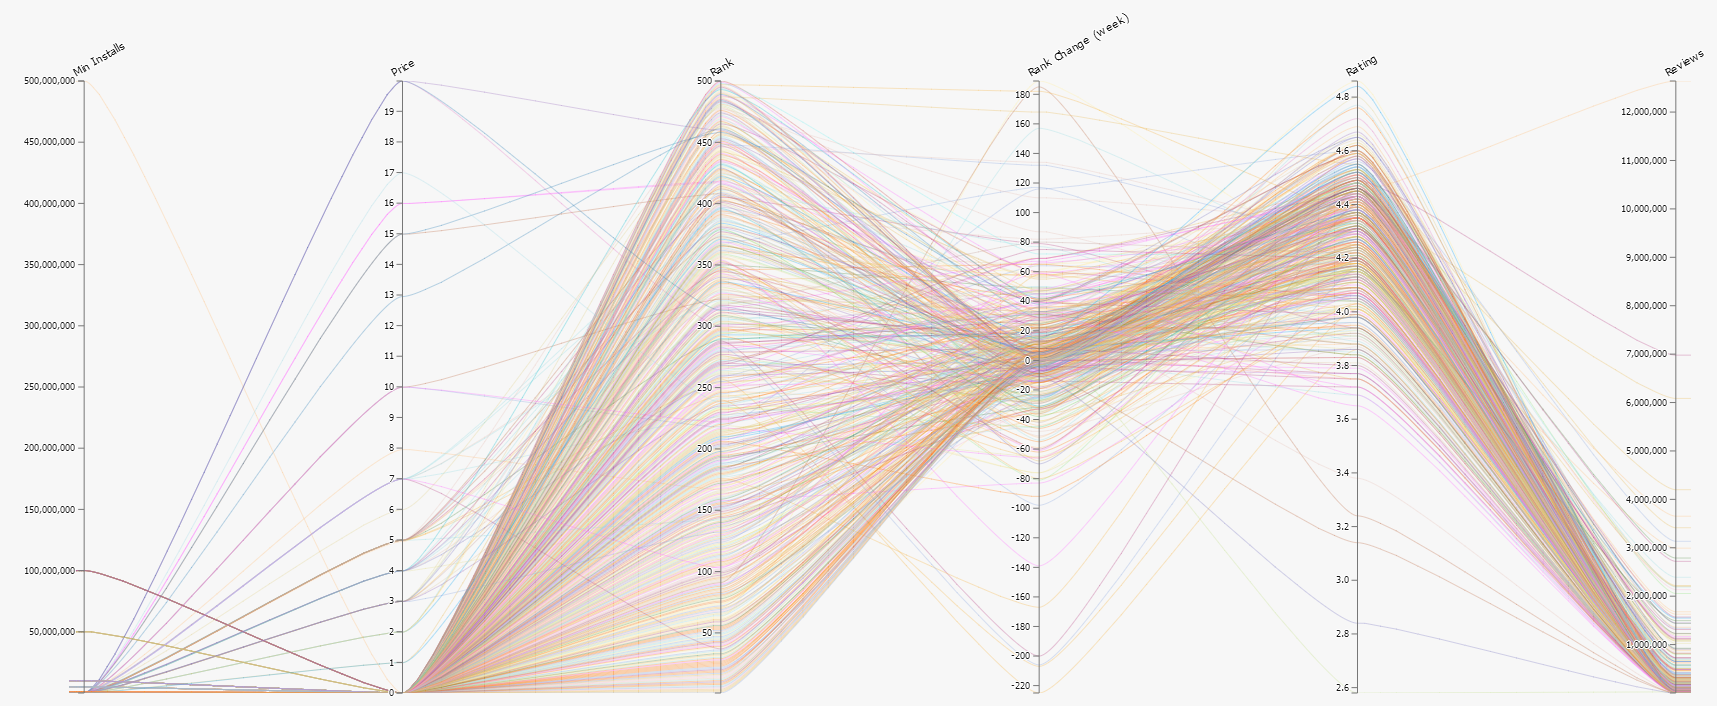
You can carefully read and play with the top here.