How a new direction in analytics – predictive – can help in creating a fritupley hit, – App2Top.ru devtodev specialists told us.
The material was written by devtodev analyst Vera Karpova with the participation of the company’s leading analyst Vasily Sabirov.

Vera Karpova
Product analytics today is a mandatory component of the operation of free-play games. Most developers can no longer imagine supporting a project without data on how users behave in the application: when they buy, where they live, how much they cost for the company and how they leave.
But today it is often not enough for successful project management, within the framework of which it is necessary not only to obtain data after the fact, but also to predict future results with sufficient accuracy on their basis. For this reason, a new type of data analysis is being actively developed – predictive analytics.
Predictive analytics is forecasting on a large amount of data
You can have an idea about predictive analytics if you monitor metrics daily, or even hourly.
For example, you know that usually at 12:00 there are about 20,000 users in your game, and today this figure is much lower – 15,000.
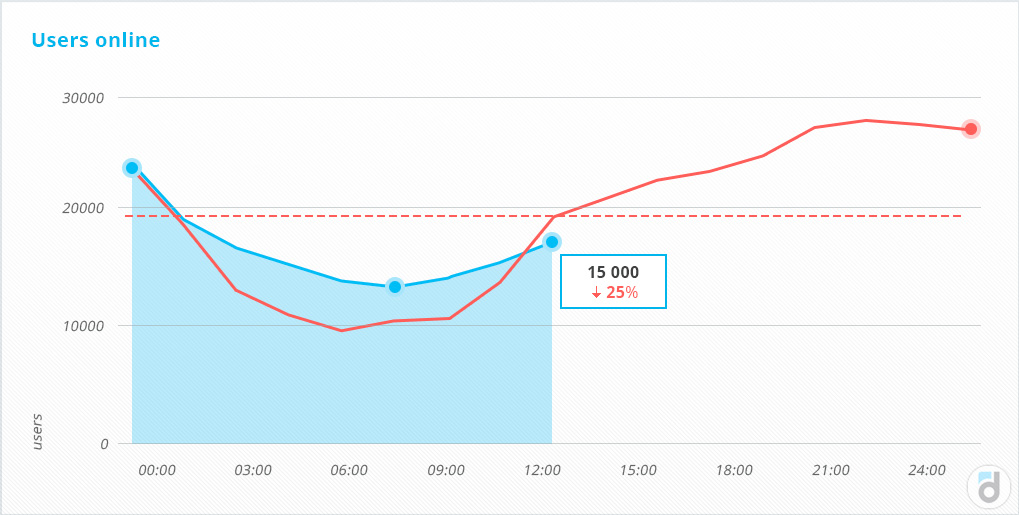
A report on the number of users who are in the game online at a certain time, in comparison with the indicators of the previous day.
Looking at the chart, you assume that in an hour the difference from yesterday’s indicator will become even greater, although this has not yet happened.
This forecast can be called predictive analytics.
It is necessary because it allows you to understand its scale at the first sign of a problem and take up its solution.
Predictive analytics is based on a large amount of user data collected over a long period, and more complex and accurate calculations.
Predictive analytics is based on the construction of a forecast based on the available information, the so–called model, which just shows what result the product is waiting for at the current dynamics.
The forecasting process mainly boils down to creating a model.
How does the forecasting process work?
The first stage of the forecasting process is data collection
The very first stage is data collection. This is the usual tracking of events in the application and most often it is already implemented, as it is used to calculate and control basic metrics, a/b tests, segmentation and product analysis. Based on these data for a long period, a model will be created later.
The second stage of the forecasting process is the selection of defining metrics
At the next stage, the parameters that are more likely to affect the predicted event are determined. Machine learning algorithms are used to identify patterns in the data (patterns). At the same time, unnecessary events and outliers are eliminated.
This is the most difficult stage, because the more different data in the application (the speed and number of levels completed, the amount of game currency, the player’s level, the method of registration, the number of days in the game, the number of purchases, the time of the first purchase, etc.), the more difficult it is to determine which parameters will affect the final event.
It is important not to overdo the screening here: the fewer factors are selected to predict a certain event, the lower the accuracy of the resulting model will be.
The third stage of the forecasting process is the creation of a predictive model
Based on patterns and historical data collected earlier, a predictive model is created that shows the probability of an event for a particular user.
The result of all the above manipulations (and we remember that any analytics is needed to draw conclusions) can be, for example, the following statement:
A player from the USA with an iPhone 7 who installed the game 2 days ago, made one purchase worth $ 3 and passed 4 levels, will leave the game in 8 days.
The fourth stage of the forecasting process is to check the forecast
Next, you need to determine how accurate the resulting model is. One way to do this is to calculate the ratio of the predicted values to the actual ones. An accuracy equal to 100% will be an indicator of an ideal model, and close to 0%, alas, is a random assumption.
To measure this indicator, you need to select a group of users, make a forecast for them and observe how much the real behavior of this segment coincides with the forecast made for it
Let’s say you predicted a certain “retention rate” of the 7th day (the percentage of users who will log into the application on the 7th day after installation) for a certain segment: “retention rate” of the 7th day (forecast) = 14.4%
After 7 days, after receiving the real data, you calculate the actual value of this indicator: “retention rate” of 7 days (fact) = 15.1%.
To assess the accuracy of the forecast, we divide the predicted data by the actual data, we get 95.4%, this will be an indicator of the accuracy of the model.
Another way to assess accuracy is to calculate how many percent the predicted value differs from the actual one and subtract from 1 the absolute value of the difference obtained.
1-|((15.1%-14.4%)/15.1%)| = 95.4%.
If reality repeats the forecast or matches at least 95%, then the model can be applied to new data; if not, then it is worth reviewing and adjusting the factors affecting the predicted event once again.
When you are satisfied with the accuracy of the resulting model, you can start interacting with users, changing their behavior based on the data received.
Knowing what actions loyal users perform in the application, who eventually make a payment and stay in the game for a long time, you can “push” another segment of players who are less inclined to buy and are determined to leave the game, go the same way, perform the same actions that make the user loyal and involved.
An important advantage of forecasting is that you know the result in advance, a few days before the target event happens. This means that you have time to keep the user in the game, encourage them to buy or involve them more in the gameplay.
Important: when building models, do not forget about segmentation, because within the same group of users (for example, newcomers, those who have just installed the application) there are necessarily users with different social and demographic characteristics and different behavior.
What tasks does predictive analytics solve?
The goal of any company is to make the player happy and stay in the project as long as possible. This means that the result of using the model should be an increase in the user’s LTV.
LTV is influenced by a number of metrics whose behavior can be predicted using predictive analytics. This includes the “churn rate”, conversion to purchase and the degree of involvement.
Predictive analytics helps to determine when a user is going to leave the game
Today, the most popular metric for forecasting is the “churn rate” (the user leakage coefficient, reflects how many users leave the product over a certain period of time). The metric directly affects revenue – the longer the user is in the game, the more revenue he will bring.
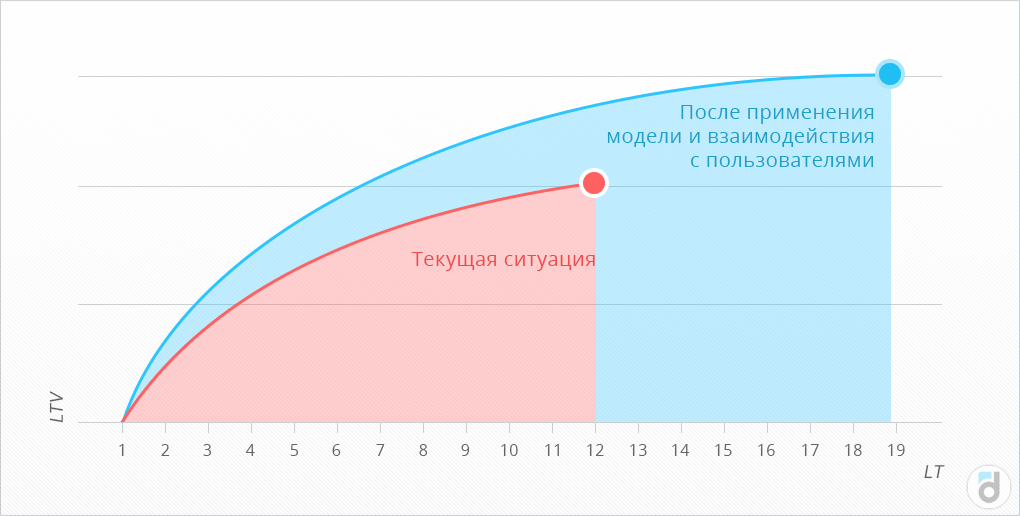
A graph of changes in the LT and LTV of users, after using the model, relative to the current situation.
The forecast “churn rate” can show:
- how many sessions will the player make in the game before leaving;
- how many users and with what probability will leave the game;
- what actions in the game are performed by users who plan to stay, and those who are likely to leave.
To build a predictive model of the “churn rate” parameter, it is necessary to determine which indicators can affect the player’s departure from the application. For example:
- the number of user sessions in the game and their frequency;
- duration of sessions;
- the speed of the game (the number of completed levels, missions);
- when was the first purchase made relative to the first session;
- how many payments did the player make in total;
- social activity (for example, participation in a chat);
- number of days until the end of the subscription;
- the player’s level reached since the first session.
The metrics that affect the event of interest and their number are individual for each game.
After you have identified the factors influencing the result, you can build an accurate model based on them and find out when users are going to leave the game, you can also start experimenting in order to increase the predicted metric.
During such an analysis, it can be revealed that, for example, users who have used the search in the application only 1 time are 75% likely to leave it within the next 14 days.
And the probability of leaving players who made 1-2 payments and passed 2-5 levels is only 35%.
Well, those who have made 5-10 purchases and passed 5-10 levels will leave the app with a probability of only 15%.
Predictive analytics helps to determine when a player will pay
The next important metric affecting revenue is conversion to purchase, especially the first one.
It may be affected by the following factors:
- user completion of training;
- passing the first level;
- the moment of meeting with the purchase;
- demographic characteristics of the player;
- technical characteristics of the device;
- game design.
Having compiled a model, you will determine:
- what makes users start paying;
- who is not going to buy anything at all;
- users with which attributes are more likely to purchase (with which device, OS, from which country).
Thanks to the collected data, you will be able to compare users who are likely to be inclined to buy with those who are not going to buy anything.
Similarly to the analysis of user withdrawal, it can be found out that, for example, players whose first session lasted more than 15 minutes are 70% likely to make a payment.
Or, for example, the probability of making a payment by users using an iPhone 6 app from Germany is 25%.
Predictive analytics helps to calculate the future involvement of the audience in the project
The degree of user engagement also affects LTV. This is the same conversion, only into an action that in your opinion is important in order to “hook” the user with the game and increase the “sticky-factor” (DAU /MAU).
Everything is quite individual here. For one game, this indicator will be the first level passed, for another – the conversion to registration or a certain number of points. For an organizer application – a task created, for a dictionary – a found word, for a messenger – adding a contact and sending a message.
In this case, you can build a model that will show which users tend to convert to this target action. Accordingly, the ways of influencing the audience in order to increase the metric will be different.
If there is an advertisement inside your application, then to determine the best moment to display it, you can build a model that segments users according to the probability of responding to it. The model will also allow you to calculate the most appropriate moment for displaying ads.
In general, knowing how a particular user will behave in the game, you can change his path, improving satisfaction with the game and, accordingly, influence LTV and increase revenue.
Examples of predictive analytics implementation
Developers from Innova have launched models for predicting the departure of players for two types of users.
The forecast of the departure of “newcomers” was based on their actions in the first couple of days, and the developers found out that a user who had been in the game for several months would leave the game 2-3 weeks before it happened, analyzing various actions of users and their impact on the result.
Electronic Arts uses predictive analytics to find “weak” places in the game, predict the departure of players, and to find out whether a particular feature will be in demand after release, based on 50 TB of data collected daily.
In the Alien Child game, with the help of machine learning (part of predictive analytics), the main character of the game is already conducting dialogues with users, accumulating data and improving answers.
Predictive Analytics Tools
More and more analytical services are embedding and developing forecasting tools in their products.
For example, Mixpanel divides users into segments depending on the probability of their target events and allows you to send targeted notifications to the selected segment.
Similarly, Localytics predicts the departure of users or their conversion. The tool also shows what characteristics the users who have fallen into a particular segment have, what actions they most often performed.
And Infer analyzes information about users to assess the probability of their conversion and sales forecasting.
At devtodev, we have launched an LTV forecasting mechanism based on payments in the first days of using the product. We can calculate how much money the average user brings in for his first day of using the product, the first two days, the first three days, and so on. And based on the information about these payments in the first days, we make the LTV forecast. After receiving information about payments in the following days, we update the forecast.
Within the framework of the service, it is also possible to predict:
- on what day and at what level do they make their first, second, third payment;
- at what level are they converted into paying / making repeated payments;
- how much do they pay in their first/second/subsequent payments;
- what do they buy at each level inside the game for real or virtual currency;
- how do they move from location to location in the game, and where do they have problems;
- etc.
Knowing these patterns, you will be able to make changes to your game, making it more user-friendly, and therefore increase their loyalty.
Let’s say you determine that on the second day in the game at the sixth level, users make their first payment by buying a chest with stars. If you send a push notification to a user who has reached this place, offer him a discount on a chest with stars, then the user is more likely to respond to your offer, and you will increase the conversion to a payer.
Features of predictive analysis
Despite the fact that predictive models can predict user behavior with high accuracy, this approach has several features that need to be taken into account when using predictive models.
Firstly, it is impossible to foresee in advance all the external factors and events that may occur in the future and affect your users and their behavior.
For example, iTunes may reindex prices for a certain country, which will change the purchasing activity in the region.
Secondly, not only external and economic events, but also your experiments can influence user behavior. Therefore, it should be borne in mind that if you are constantly experimenting, any test, especially related to prices, currency and goods, can greatly affect the behavior of players, which means that the forecast compiled from old data will cease to be relevant.
What to expect from predictive analytics?
To date, when building a predictive model, the most important task is to determine the parameters that most strongly affect the predicted event.
And the best way to do this is for a person who has experience in the subject area, and even better – in a specific product. And only such a specialist who knows his user can adjust the specified parameters to increase the accuracy of the forecast.
Thus, the human factor plays an important role in forecasting. Therefore, the next step expected from predictive analytics should be a greater degree of automation – so that machine algorithms themselves determine these parameters that affect the result and identify which event in the user path needs to be changed in order to qualitatively change the resulting event.
Another expected direction of predictive analytics development, according to experts: the ability to personalize games by selecting the most optimal parameters of the gameplay (difficulty level, reward systems, locations, etc.) and monetization for each player.
It is already possible to collect any data about the user’s behavior in the game, and each interaction with him can both increase and decrease income, both improve and disrupt his further behavior. Therefore, in the long term, machine learning can lead to the fact that the game itself will adapt to a particular player, correcting his path and maximizing income.
Now companies are trying to focus not on what their users did in the past, but what they are going to do in the future. And predictive analytics is a new tool that will allow not only to predict this future, but also to control and adjust it.
“The past and the present are our means, only the future is our goal.”
Blaise Pascal