Stepan Solovyov, Marketing Director of Appodeal, told his observations about the nature of the relationship between the rating and the position of games in the top.

Observation #1 – Stars matter
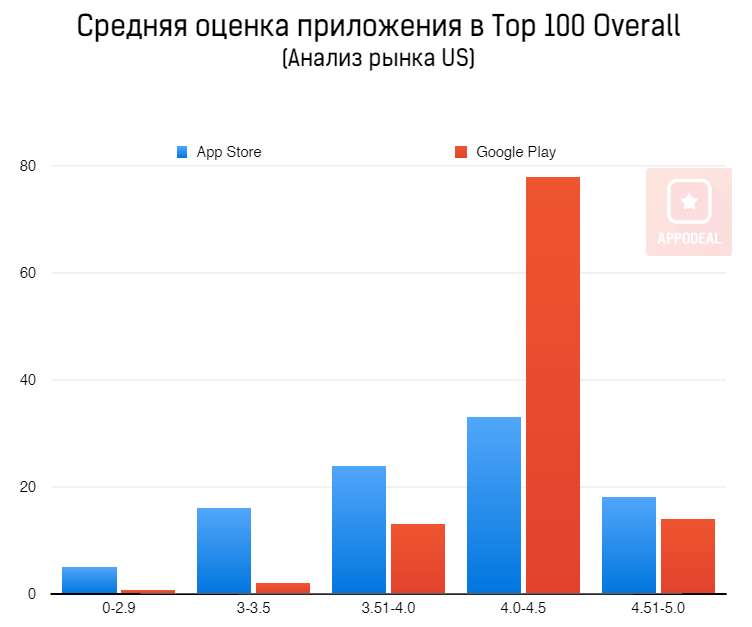 App ratings affect positions in the top:
- About 78% of Android apps in the Top 100 have a rating of more than 4 stars.
- About 50% of iOS apps in the Top 100 have a rating of more than 4 stars.
- The average rating of top Android apps is 4.2 stars.
- The average rating of top iOS apps is 3.8 stars.
Observation #2 – It’s not just about the stars, but also about their number
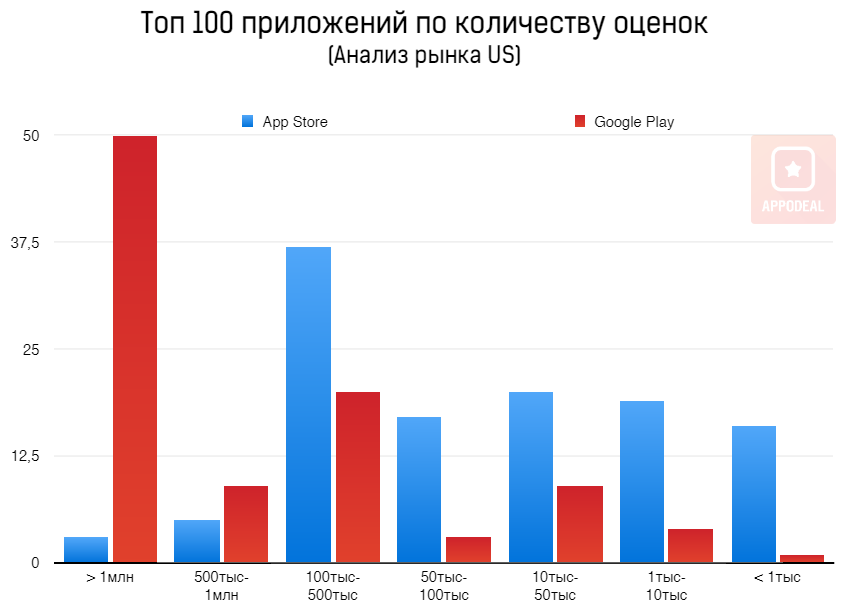
Top apps not only have good ratings, they have a lot of ratings:
- Almost 50% of the top Android apps have more than 1 million ratings.
- Only 37% of top iOS apps have more than 100 thousand ratings.
- The Android app from the Top 100 has, on average, 3 million ratings.
- The iOS app in the Top 100 has, on average, more than 150 thousand ratings.
- 2/3 of all applications have a zero rating.
Observation No. 3 – The problem of instability of the position in the top
A little below we consider the changes in the position in the tops of the same applications in the App Store and Google Play. I have selected 5 games and they all meet the following criteria:
- They are in the Russian Top 500
- The iOS and Android versions of the apps are almost identical, which means that the apps should have approximately the same rating.
- Games from various categories.
I chose:Fruit Ninja Free, Sea Battle, Asphalt 8: Airborne, Fifa 15 Ultimate Team, Game of War – Fire Age. These games cover the following categories: arcade, board games, racing, sports/simulators and strategies.
Assumption
Before starting the analysis, I assumed a somewhat greater instability in the App Store, since Android applications receive much more ratings than on iOS, therefore, a low rating in Google Play will not affect the app rating as much as in the App Store. Let’s check it out now:
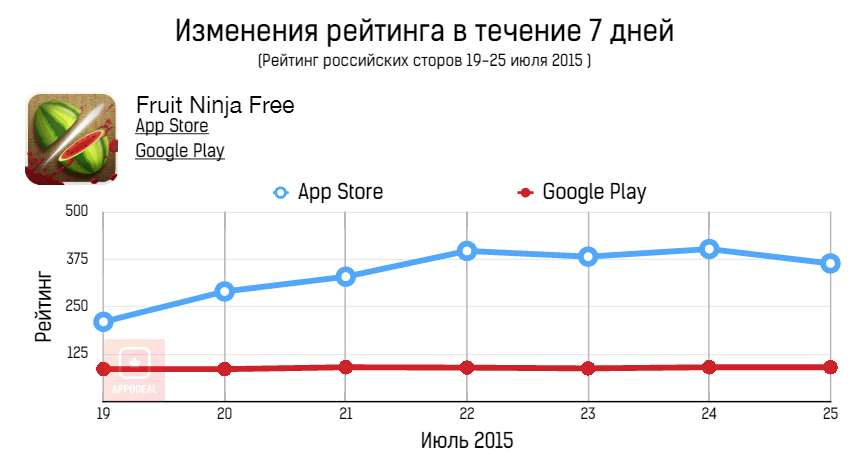
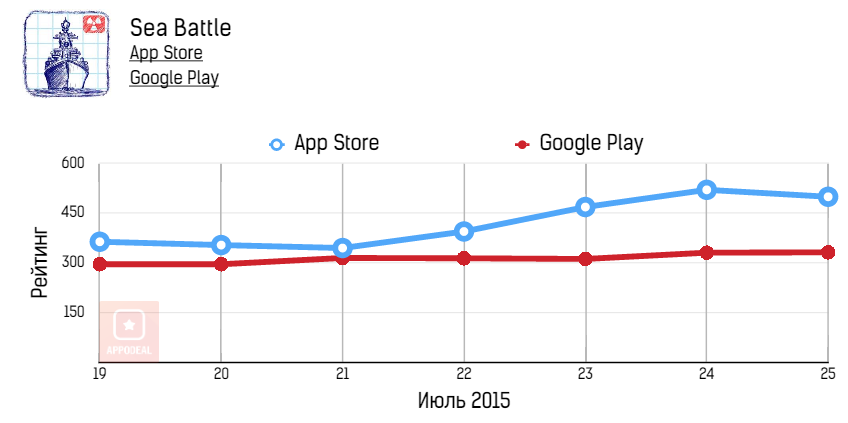
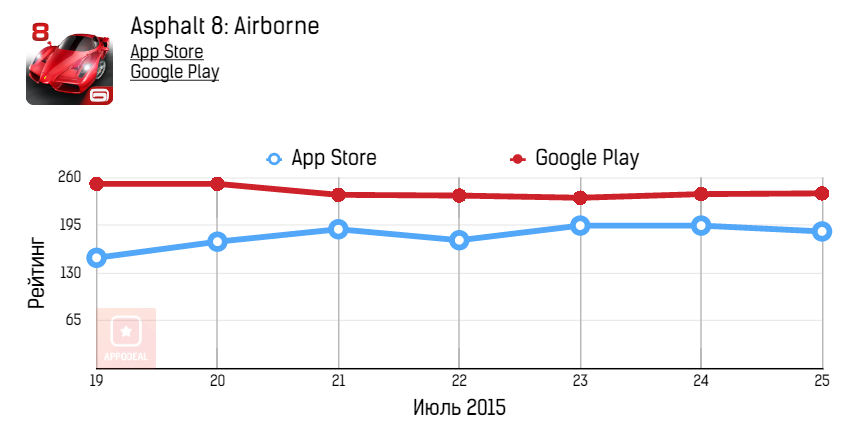
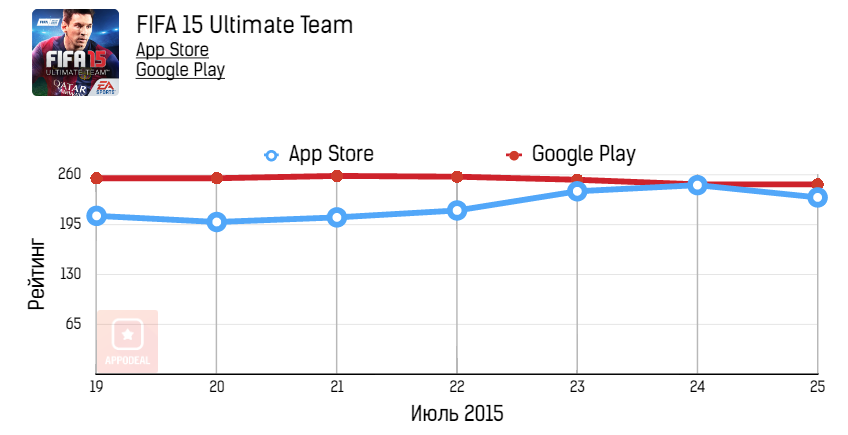
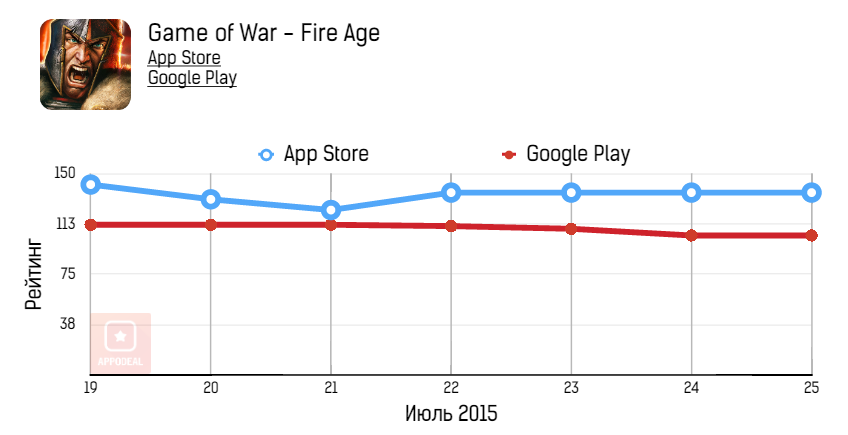
Note: on these charts, the “rating” meant the position of a particular game in the top
Judging by the statistics, we see that in Google Play, the position of applications in the tops is indeed more stable.
For Android applications, the spread reached 36 positions during the week (Sea Battle), while for iOS, the spread was 74 positions per day (Sea Battle) and 154 per week (Fruit Ninja Free), which indicates greater stability of the ranking in Google Play.
Pay attention to the synchronicity of changes in the position of the positions in the tops. This means that users of these platforms have a lot in common.
Based on these data, I draw the following conclusions:
- In most cases, the position of applications in the Russian Google Play charts is more stable than in the Russian Apple App Store.
- The stability of the position in the top largely depends on the evaluation of the application: a low score is unstable behavior in the top.
- On average, Google Play apps get 10 or even 15 times more ratings than App Store apps.
- Applications with a rating of 401-500, on average, receive only 10-20% of the number of reviews of applications from the Top 100.
In the end, I want to add that in the App Store, the version of the application and reviews still play a more important role. With Google Play, everything is somewhat different: the main thing here is the rating, because an application that has less than 4 stars is unlikely to be able to get into the Top 100 for at least some time.
P.S. I would also like to remind you that despite the fact that neither Apple nor Google disclose the algorithms for calculating the rating, everyone agrees that the most important factors affecting the position in the top are:
- The average rating of the application (total score, number of stars).
- Number of ratings/reviews.
- The number of downloads and installations.
- Deletions (how many users left the application, and how many were deleted).
- User engagement (how often they open the app).
- The change in the number of downloads over a certain period of time and the ratio of the rating “today”/”during the past week.”
- Concentration of keywords on the application page in the store.