How to use RFM analysis to study user behavior and how they make payments, – says devtodev analyst Vera Karpova in our series of materials “Performance indicators of games”.
The publication is published as part of a series of materials about game metrics from App2Top.ru and devtodev. Articles are divided by seasons, each of which is dedicated to a specific topic. The second season is called “Users”. In it, we talk about those business metrics that reflect the effectiveness of the application in terms of working with the audience.

Vera Karpova
In this article we will talk about another segmentation tool for paying users – RFM analysis. It divides users into certain groups depending on the prescription (R ecency), frequency (F requency) and total amount (M onetary) of their payments.
Usually, the task of such an analysis is to study the behavior of users, how they make payments in order to make more relevant offers for each of the selected groups formed according to three criteria.
- Recency – the difference between the current date and the date of the last payment made by the user.
- Frequency – the number of transactions that the user made during the time period under study.
- Monetary – the amount of the user’s purchases for the same study period
All these three indicators are calculated separately for each user for the selected period, after which users should be assessed according to each of the three criteria. The range of ratings can be different: 1-3, 1-4, 1-5 and so on. The wider the range, the more groups you will get and the more “sensitive” and more accurate the indicators will be, but at the same time, the harder it will be to work with them because of the wide variety of combinations.
Two methods are usually used to assign points to users:
1) Fixed ranges
In this case, it is necessary to independently determine the boundaries for each of the criteria, using your experience with the product, to determine what a payment made a long time ago, recently, for a large amount or an average amount, and so on means. Then you need to assign appropriate ratings to users.
For example, you can set the following frames for RFM parameters:
Recency
a) Those users who paid the last time a long time ago (more than 14 days ago) will receive 1 point.
b) Those who paid 8-14 days ago – 2 points.
c) Those who paid the last time recently (1-7 days ago) will receive 3 points.
Frequency
a) Those who have made only 1 payment for the selected period – 1 point.
b) Who paid with average regularity and made 2-3 payments – 2 points.
c) Who paid often and made more than 3 payments – 3 points.
Monetary
a) Those who paid $1-$10 get 1 point, since this is the minimum payment amount in the project.
b) Those who paid $11-$20 will get 2 points
c) Those who have left more than $20 in the product will receive 3 points.
2) Quantiles
The second method of defining boundaries is the use of quantiles. To do this, you need to sort the data by one of the criteria, for example, by the number of payments, and then divide the users either into equal groups (for example, select 4 groups of 25% of users each), or select the first 10% of users and assign them the maximum score as paying a lot, the next 50% – 2 points, and those who paid very little (40%) – 1 point. In this case, the boundaries are determined by experts.
Let’s try to use these methods as an example and assume that we have the following data about users.
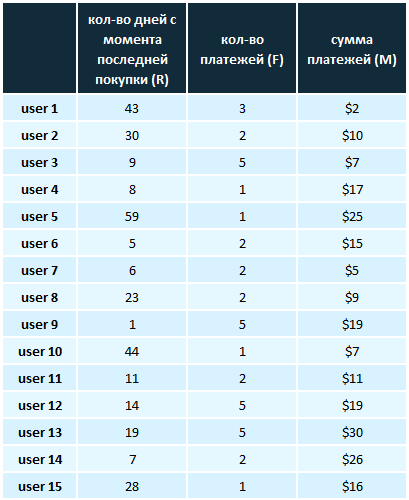
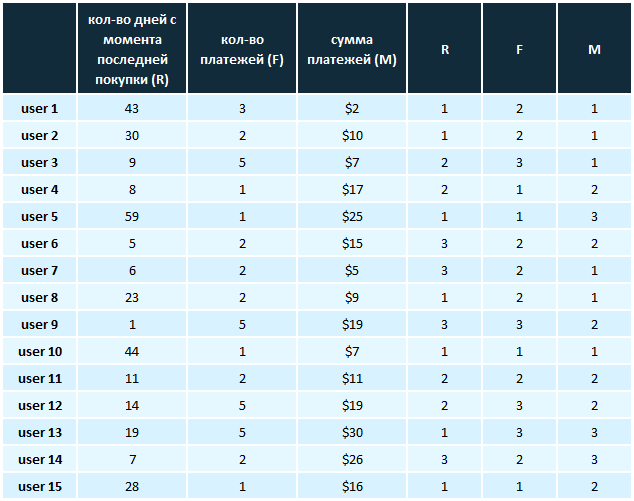
First, we will try the method of fixed ranges and use the ones described above as the boundaries of each measurement, after which, based on these values, we will assign an estimate to each user.
Now we will assign points to users using quantiles. To do this, you need to arrange them in ascending order of one of the three indicators and divide them into equal parts (let there be 3 of these parts).
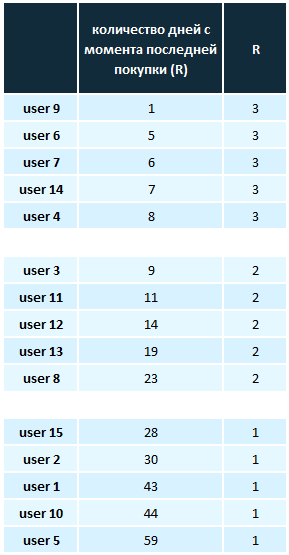
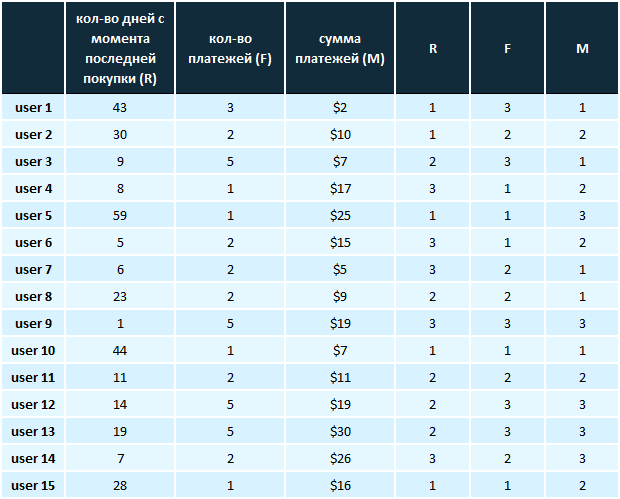
This should be done for each indicator. As a result, we get a table with scores.
When the ratings are set, users can be grouped into specific segments. In our example, we use the first option of scoring, when the boundaries were set by an expert method.
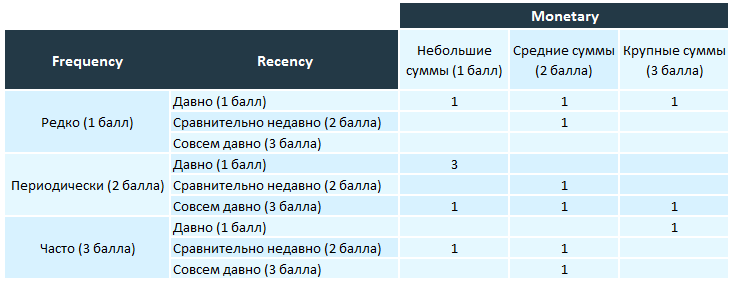
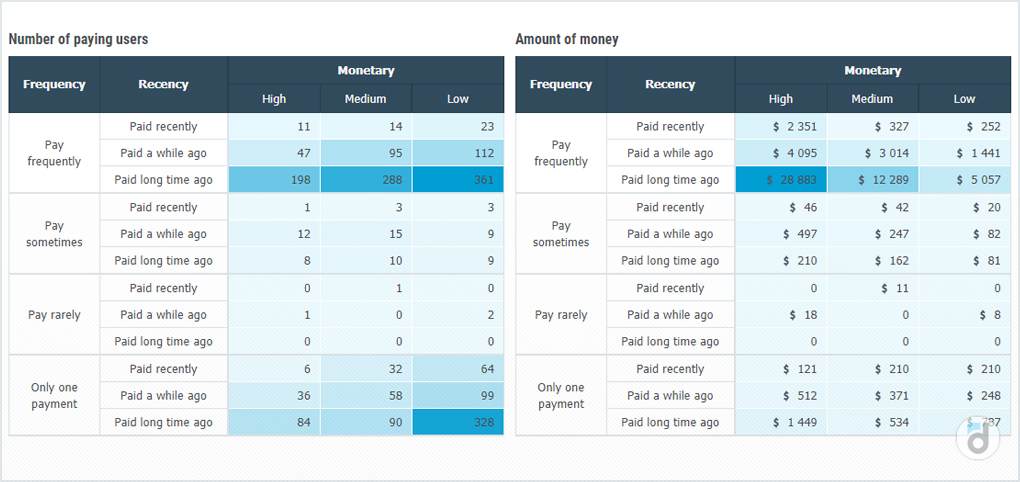
And in addition to the number of users in each segment, we will calculate the income from them.

From this it can be seen that the greater number of users are those who paid with average regularity a little and for a long time.
Such users are most likely lost to the project, but you can still try to get them back by contacting them in some way and offering something that may be useful and interesting to them at this moment, thereby saving them in the project.
The purpose of RFM analysis and the formation of segments is to influence them in a certain way, depending on the payment behavior of users: send push or email notifications, offer bonuses, offers and discounts, unblock content, and so on. Moreover, it is important to do all this in a targeted manner with a message that will be relevant to each individual group.
As a result of these actions, retention can be improved by returning to the project those paying users who have ceased to be active, you can increase revenue by converting users who have made one payment, thereby preventing the outflow of loyal users.
Here are some examples of segments that can be identified as a result of RFM analysis:
1) Those who paid often, a lot and recently (R=3, F=3, M=3) are the most loyal and active users who need to be protected and maintain their interest in the project.
2) Their complete opposite (R=1, F=1, M=1). Most likely, these are already lost users: they have been paying for a long time, little and rarely.
3) Those who once paid a lot and often, but for a long time (R=1, F=2/3, M=2/3) are loyal users on the verge of leaving. Like the previous category, you can try to return them to the project by sending a push notification or offering a bonus or discount
4) Those who have recently made one payment (R=3, F=1, M=X) should be motivated to make repeated payments.
Since there are 3 indicators in the analysis, standard graphs or tables usually have 2 dimensions, most often 2 of them are combined. Usually it is “frequency and monetary” or “frequency and recency”, as in devtodev.
It is worth noting that the monetary indicator is not always taken into account for segmentation of paying users. One of the varieties of such segmentation is RF analysis, which takes into account only the prescription and frequency of payments, reducing the number of groups and simplifying the perception of the results.
RFM analysis is a useful user segmentation tool that allows you to analyze the paying audience of the project, identify the prevailing segments, thus identify weaknesses in the application, as well as increase key product metrics such as retention, conversion and revenue, interacting with each user segment in the most appropriate way for it.

Read also materials about other metrics:
- 4 types of retention: what is retention?
- What do I need to know about retention?
- How to make the first session better: working on keeping the 1st day
- Learning to work with the consumer basket (another way to improve monetization)
- Segmentation of paying players
- Lifetime
- Stickiness
- Conversion Funnel
- Outflow of users
- Total daily play time
- Average session duration
- Social LTV
- Downloads
- Active Users (DAU/WAU/MAU)
- K-factor (virality)
- Loyalty
- The first season of “Performance Indicators of games” has ended