How fundamentally different is the behavior of paying users from non-paying ones, – GameAnalytics experts told in their extensive report. And we, in turn, have prepared a short version of the report in Russian.

Instead of discussing how to achieve a high conversion rate, GameAnalytics has prepared a report answering the question of how the behavior of paying and non-paying users differs.
Methodology
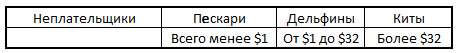
As can be understood from the information already mentioned, analysts worked with two main categories (non-monetized and monetized users). For the accuracy of the analysis, the paying audience was divided into three additional types: minnows, dolphins and whales.
A total of 175 million users were analyzed. Monitoring was carried out for three months.
The results were as follows:
- Cohort 1 = Defaulters = 114 million – 97.91%
- Cohort 2 = Minnows = 1.2 million – 1.03%
- Cohort 3 = Dolphins = 1 million – 0.86%
- Cohort 4 = Whales = 230 thousand – 0.20%
In total, it turned out that out of all the millions of users, only 2% could be attributed to the paying audience.
In addition to this, it is important to note that 25% of non-paying users have logged into the game only once for the entire time. 40% of non-payers visited twice or less in three months.
Most likely, all these users tried the game and then fell off, which is a reflection of the usual user behavior: downloaded the application, tried it once and erased it.
Results
GameAnalytics compared user behavior by cohort based on the number of games they play.
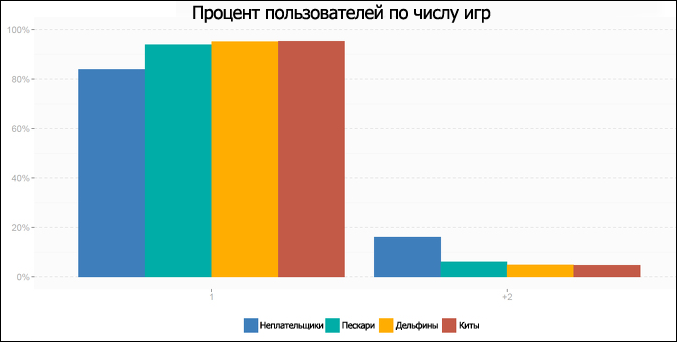
The graph above shows that non-payers play more games (from 2) than paying users.
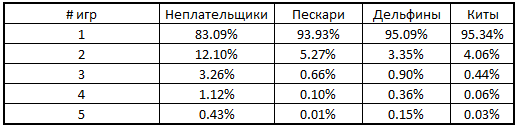
This is more obvious from the table below, which shows the inverse relationship between the number of games played by the user and his spending on games.
Obviously, whales are much more loyal than non-paying players.
Also interesting was the observation that non-payers enter the game more often than anyone, and whales more often than minnows and dolphins.
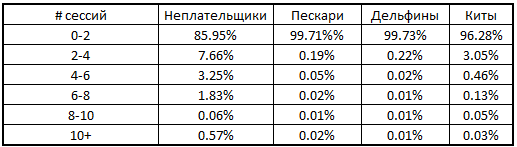
But, in general, it is obvious that the paying audience is not as active as the non-paying one.
Deep analysis of monetized users
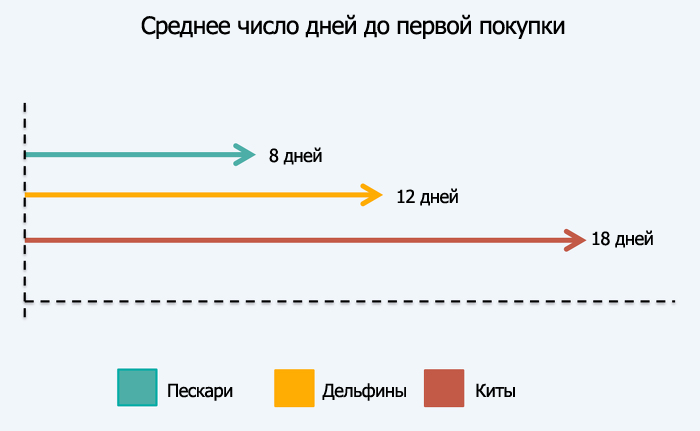
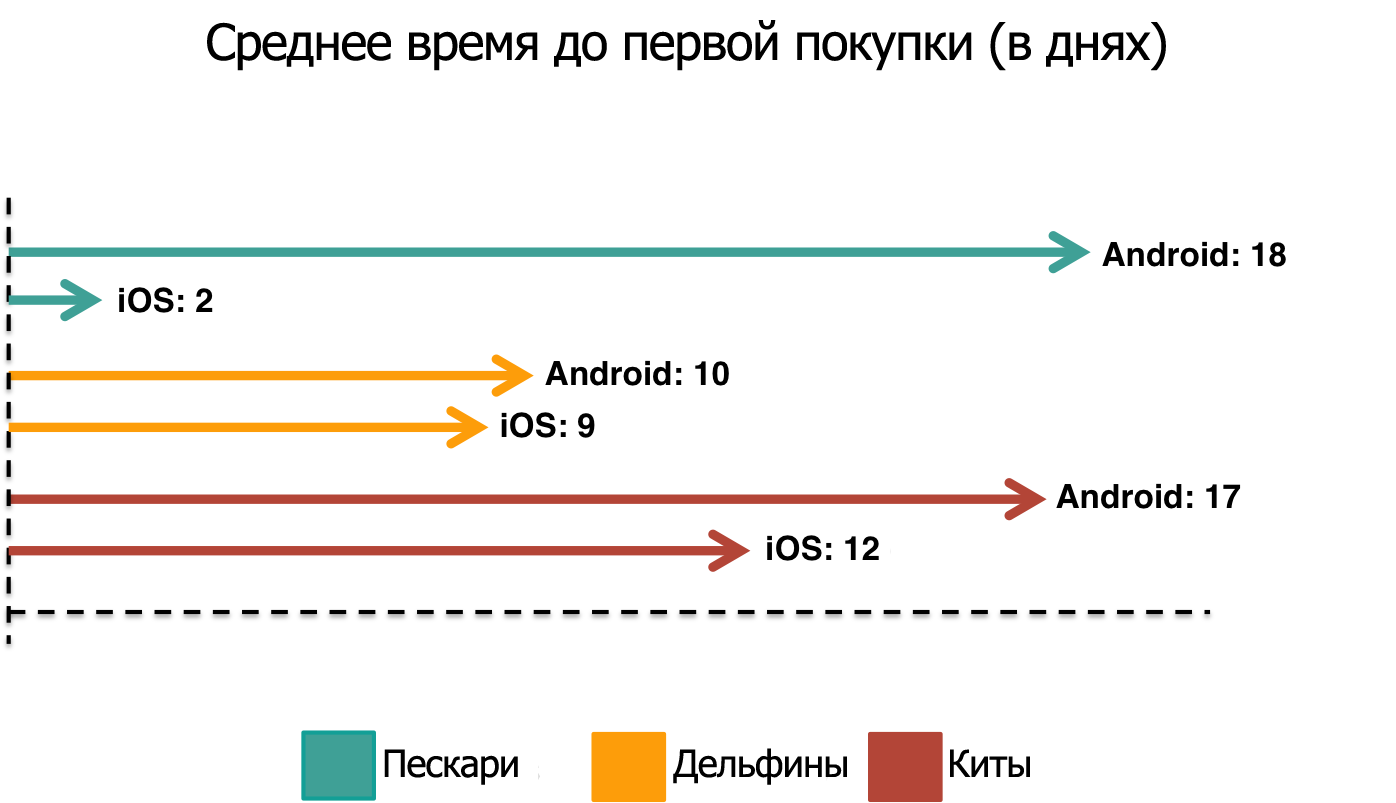
The next important observation is that whales take the longest time to make their first purchase. If minnows, on average, make a purchase on day 8, and dolphins – on day 12, then whales need 18 days to make such a decision.
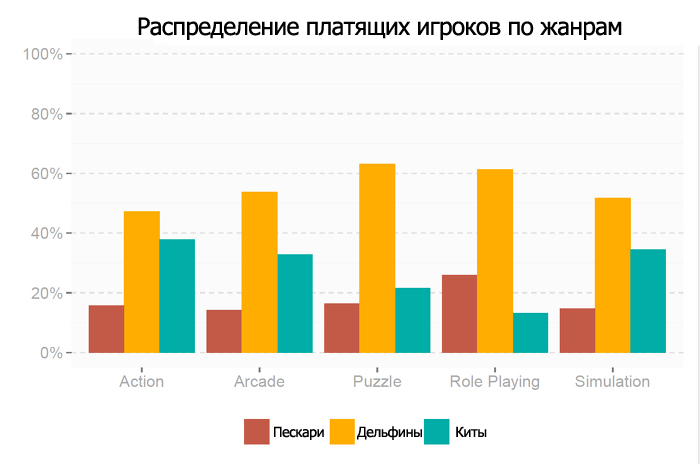
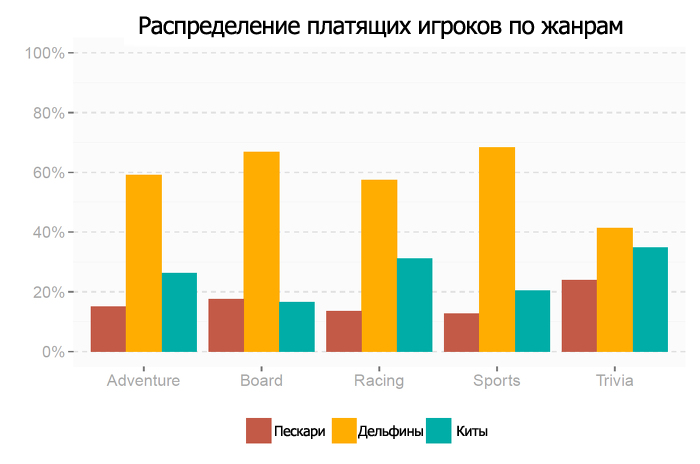
Also, different types of payers invest differently in games of different genres. This is most clearly seen in the graphs below (but here, by the way, the GameAnalytics approach raises very big questions, because for some reason there are no strategies among the genres under consideration that generate the most money today).
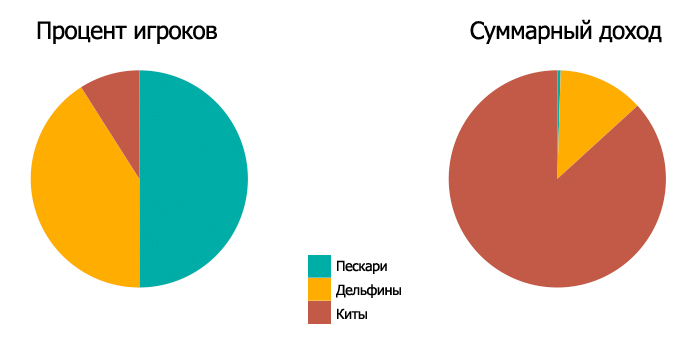
By the way, despite the solid number of minnows among payers, their contribution to gaming earnings is quite insignificant – less than 1%. But whales generate about 86.6% of income.
It is also interesting that the stratification of payers by type is seriously different between Android and iOS. If minnows dominate on Android, then dolphins dominate on iOS.
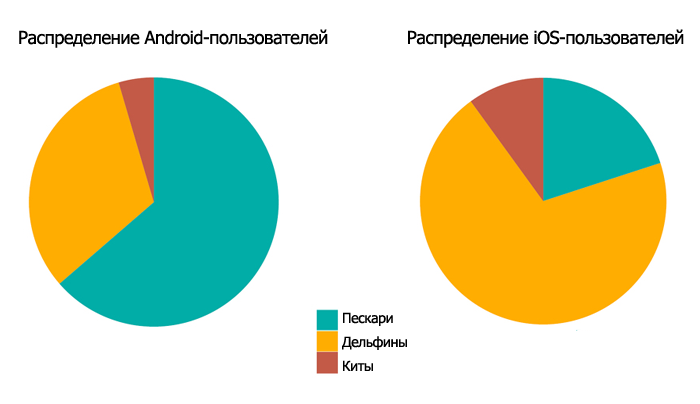
Also, the behavior of the paying audience significantly depends on the platform. Moreover, general patterns are lost. The same minnows on Android, on average, wait 18 days, but on iOS – only 2.
The difference between the indicators will also be if the segmentation of paying users by country is carried out. For example, there are significantly more whales in China than in the USA.
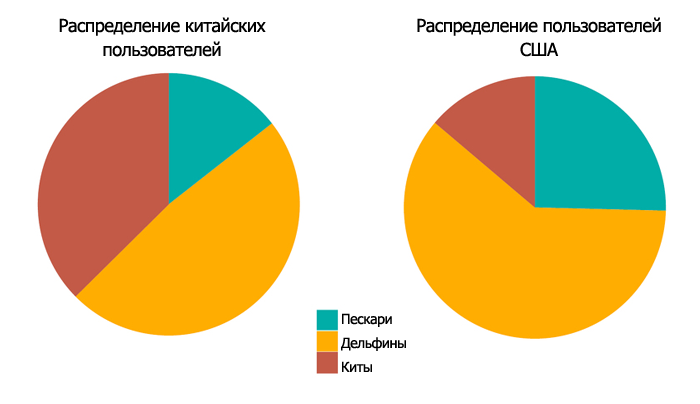
Moreover, Chinese whales pay more. On average, their payment is $347 versus $283. This is also true for the dolphins of the Middle Kingdom, whose payment, on average, is twice as large as that of American dolphins: $120 versus $67.
Result
Defaulters:
- I play a large number of games;
- they play more often.
Paying players:
- more loyal to one game (especially whales);
- whales are the most involved among all payers, but it also takes more time to convert them;
- There are more whales on iOS than on Android;
- It takes more time to convert Android users into paying users.
A source: gameanalytics.com