How to analyze your own project correctly, which algorithm of actions to resort to when searching for problems, – says Vasily Sabirov, chief analyst of devtodev.
Initially, the material was read in the format of a report – including at White Nights St.Petersburg 2017. Sabirov wrote an article based on his motives.

Vasily Sabirov
The analysis of the project can be compared with how a person is examined by a doctor. The diagnostic algorithm is about the same.
- First you measure the basic indicators.
- If this is enough to make a decision about what to do in this case, to treat or not to treat (and if treated, then how), then this is the end of the diagnostic algorithm.
- If not, then a more detailed study is required.
In both cases, you should not self-medicate. An analogue of a therapist for a game project will be a producer, analyst, game designer. And it is possible that after consulting a “therapist” you will need to turn to a more narrow specialist (say, a level designer).
In this article, we want to talk in detail about the algorithm for analyzing the game from the initial diagnosis to detailed studies.
The algorithm consists in a step-by-step evaluation of the project at five conditional levels.
Level 1. Scale Metrics
What does the doctor do first? He looks at the patient, assesses his height, weight, physique. The scale metrics for the project are an analogue of such a basic inspection. What are these metrics? It’s about the basic indicators of the project:
- income,
- audience (DAU, WAU, MAU),
- new users,
- peak online.
Usually these metrics are enough to compare the scale of several projects with each other, just to understand how big the project is, how its scale changes in dynamics.
It is these metrics that you will include in the report for investors, because it is most important for them to simply understand how much money the project generates.
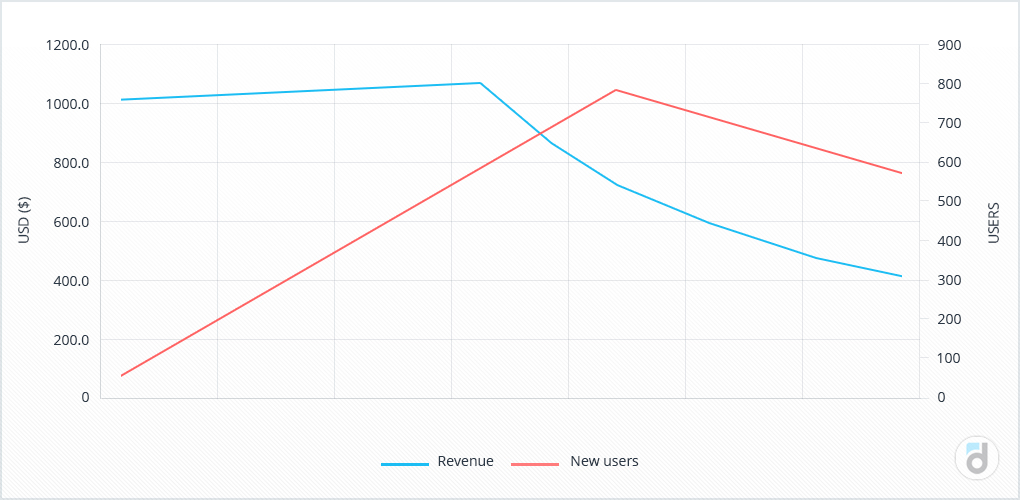
For a lot of projects, all analytics comes down to these indicators. However, practice shows that they are not enough, a more in-depth analysis is required. There may well be a situation in which both income and audience grow, and then a certain turning point occurs, and metrics reach a plateau, and then begin to gradually decline. And armed only with these metrics, you will not be able to understand the reason.

Level 2. Project quality metrics
After we have understood, thanks to the metrics of scale, what we are dealing with, we go to the metrics of the quality of the project.
It is very easy to distinguish quality metrics from scale metrics: they are measured not in users and conventional units, but in percentages and conventional units per user (per user).
We are talking about metrics such as:
- Retention (day 1 retention, day 7 retention, day 28 retention, and so on) – the percentage of users active in the project N days after logging in;
- Rolling retention for the same periods – the percentage of users active in the project after N days or later after logging in;
- Churn (outflow of users) – the percentage of users who left the project;
- Lifetime – average time spent by the user in the project;
- Sticky factor = DAU / MAU; an indicator of the “stickiness” of the project, indicating the regularity of user inputs;
- ARPU, Average revenue per user = Revenue / DAU (or MAU, depending on which period you count) is a value that indicates how much money one active user brings in on average over the period;
- ARPPU, Average revenue per paying user = Revenue / Paying users; a value that indicates how much money one paying user brings in during the period (taking into account repeated payments);
- Paying share – the share of paying users among active;
- LTV, lifetime value – how much money one user brings on average for the entire time they stay in the project.
By these metrics, you can’t tell how big the project is, but you can tell how well it works. And if sooner or later you have a choice which of the metrics to increase first, qualitative or quantitative, then start with qualitative ones. A well-functioning project will find its audience easier.
And it is these metrics that can tell you what is wrong in your project (or at least hint where to look).
Case 1
Let’s take an example: your income has started to fall. What’s wrong?
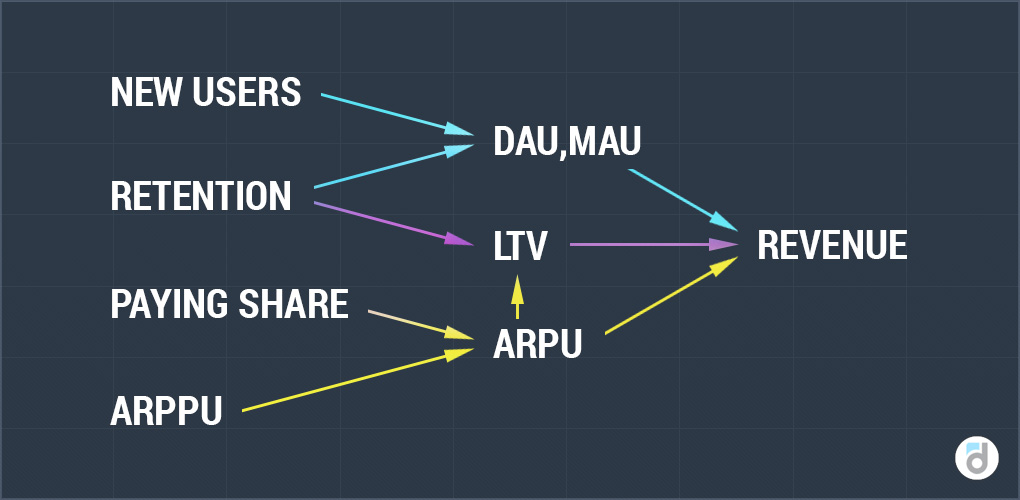
A tool such as a metric map will help you. Below you can find a simplified and fairly universal map. In fact, I would recommend combining all the metrics at hand into such a map, placing arrows between them indicating cause-and-effect relationships between indicators.

So, income is falling. What to do?
Revenue is the product of quantity by quality, that is, audience by ARPU. Check which of the metrics is associated with a drop in your income. Let’s say the audience is stable, but ARPU has really started moving down. Let’s figure it out further. ARPU, in turn, is the product of the share of paying (paying share) on the income from the payer – look for the reasons in one of these two metrics. Let’s assume that the share of payers is stable, and the drop is caused by a decrease in ARPPU. Well, we have localized the reason for the drop in income to one metric.
What could be the reason for the decrease in ARPPU? There are possible options. For example, this happens when prices decrease in a project: you expected that the price reduction would increase the share of those paying, but in fact only those who paid earlier pay, just less. Or you conducted a low-quality promotion, and users (who were previously paying) simply took advantage of it. Or the structure of the paying audience has changed, and now mostly newly appeared players are paying.
Various hypotheses are possible here, and in order to understand the issue in more detail, we need to go down one more level deeper.
Level 3. Events and Funnels
We go down one more step below. At the third level, we study how the processes in the game work effectively.
I’m talking about conversion, that is, the proportion of users who performed a specific action (those who viewed the game in the store and eventually bought it / those who registered and passed the tutorial / those who made the first payment / those who made step B after step A).
A detailed study of conversions within your project is a step towards a better understanding of user behavior, and therefore to the subsequent optimization of your project.
Let’s say you see that users registered with Facebook do not pass the tutorial – this is an excuse to figure out if there is a technical error (we had such a case, the game was just crashing there, and hello!). Or if you compare the conversion rate of opening a virtual product in a store and buying it, then you can identify which products are better described to correct.
In order to count conversions well, you need to place the transmitted events clearly and correctly when integrating the analytical system.
A lot of people are limited to only two events: entry and payment. This is enough to calculate all metrics at levels 1 and 2, but not enough for a more detailed study of the user trajectory. Therefore, we always recommend transmitting other important events (custom events) in order to build event funnels, find bottlenecks when moving from step to step and thus delve into user conversions.

Here are some recommendations from devtodev:
1) Highlight the key events. What do you expect from the user? Making a purchase, obviously. What else? Clicking on the “Tell friends” button, completing the tutorial, activating at level 5, there are many options.
2) Think through the sequence of events before the key event takes place. For example, in order for a user to make a purchase, he needs to open a store, select the desired product, read its description, click on the “Buy” button, confirm the purchase. It is also better to transmit all these events that make up this “neighborhood” of the key event. Then you will be able to build funnels and find out at which steps users are not doing what you want them to do.
3) You can estimate in advance which funnels you will build, which stable sequences of steps your users perform. This will help add a few more tracking events.
4) Work out the event parameters. What other information about the perfect event do you want to take into account in future funnels? If the user, for example, killed the boss, then it may be useful to track how long and how many steps, what resources were spent on it.
5) It is important to distinguish between user parameters and event parameters. The first ones are the installation date, country, device, language, and so on. The second are the properties of exactly the event that the user performed. As a rule, analytical systems have restrictions on the number of parameters passed in an event, and it makes sense to pass exactly the properties of the event in these parameters. And the system must take into account the user’s properties separately (at least in devtodev this is how it works).
6) Pay special attention to the tutorial. The first session is very important, and not only in games. The peculiarity of working with the tutorial is that changes are usually quite cheap (say, just change the text on the hint), and their impact can be significant (retention of 1 day can rise significantly). We recommend transmitting events in the tutorial in as much detail as possible. At least in devtodev, up to 120 events can be transmitted in the tutorial funnel, and our clients use this.

Level 4. The structure of the game
The next stage of the analysis is the consideration of its structure.
Each game is unique (not counting clones), and it’s not so easy to find two games with exactly the same structure. Nevertheless, analyzing the structures of many games, you can find some common features.
In particular, we at devtodev have identified two entities that are very common in games:
- Player level. The player gains experience, develops, becomes more skilled, and this increases his level (they say some elves reach the eightieth!). After the first level, there is always a second one, and the passage of the level is usually associated with another value (most often it is experience).
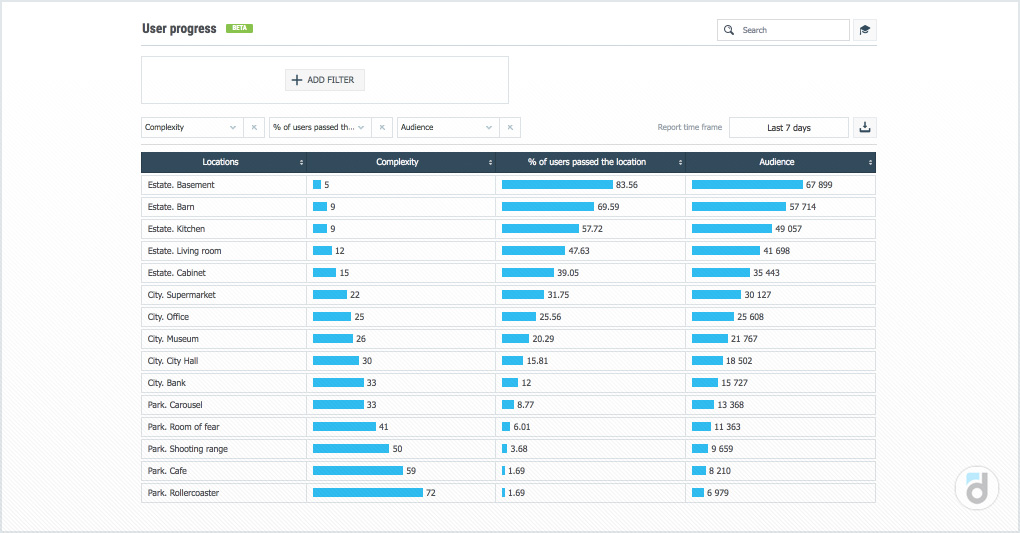
- Game location. Here we are talking about the level in the game, not the level of the player. We are talking about some “geographical” point in the game where the player is located. The player may or may not pass the location, may get stuck on it. And location N is not necessarily followed by N+1 – the order between locations is not necessarily linear.
We recommend using sections of levels and locations when analyzing the game in detail. Thus, you will be able to see the distribution of players by levels / locations, measure the dumps in these sections.
In addition, devtodev allows you to track the change of any numerical parameter of the location in recalculation for an attempt, successful or unsuccessful (these can be steps, health units, boosters, whatever).

Consider the case. In one of the games, we noticed that players get stuck at level 7, moreover, they do not fall off from it, but continue to play, but do not move to level 8.
It turned out that the players were simply afraid to go to level 8. In this game, the first 7 levels were initial, and the levels starting from the eighth were conditionally “professional”. That is, the players just wanted to be the best of the newcomers (and play for fun), rather than the worst of the professionals. Such a sharp transition in the complexity of the game is a mistake of game design and in particular the matchmaking system, and game designers had to correct it.
Level 5. The economy of the game
The final stage of the analysis is the study of how the project economy works.
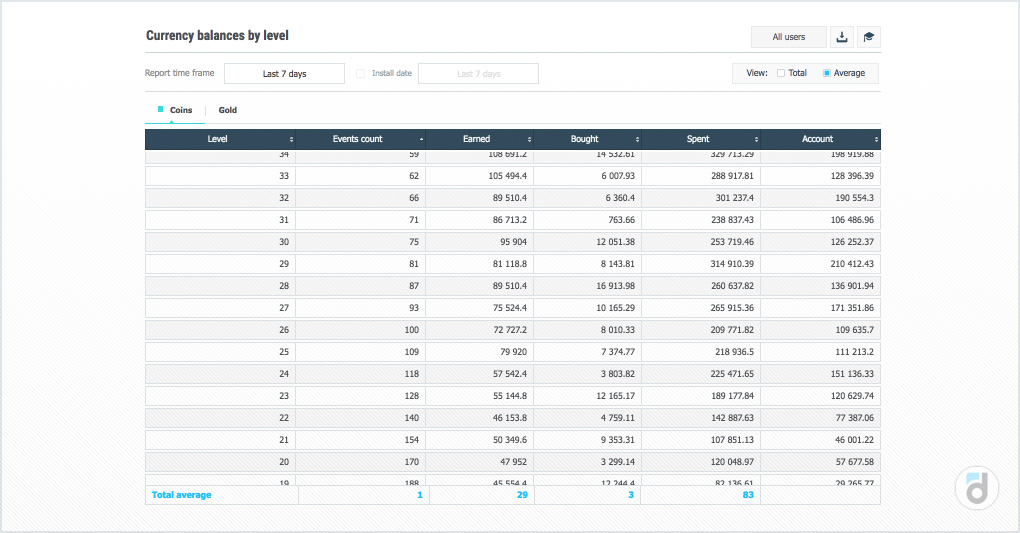
The player, moving through the game, makes purchases, whether for real or virtual currency. And I would recommend tracking at least the following indicators in the context of game levels and player levels:
- accumulating currency on the player’s account;
- average expenses;
- average earnings in the game;
- average number of currency units purchased;
- basic purchases.
Analyzing these values, you can notice an imbalance (usually it manifests itself in the form of sharp jumps of indicators up or down) in the gaming economy. Then this imbalance can (and should!) edit by changing the parameters of purchases (for example, to adjust the price of the chest), as well as by shares (if you see that a lot of currency has accumulated at level X, and players there prefer to buy product Y, so give a discount to all players of level X).

Conclusion
Thus, the algorithm for working with the project should look like this: first we look at the main indicators of the project, then we work with quality indicators, switch to events and funnels, study the structure of the game, and in the end we take on the economics of the game.
It is important to remember: analytics does not make sense just for the sake of analytics, it is important for decision-making. And we believe that the algorithm we have proposed, even if it is very simple, allows us to analyze the game in detail, find its problems and growth points, and make the right decisions on its development.
Good luck with your game!
Postscript
There is another level of analysis – by audience segments.
If you draw conclusions not for all players at once, but in the context of clearly highlighted segments, you increase both the quantity and quality of the hypotheses produced. As a result, your decisions become more precise and verified. Here are some examples of highlighting user segments that we consider appropriate:
- Paying – non-paying. In general, there are two different worlds in the game. Your task is to drag as many people as possible from non–paying to paying. To do this, you need to know their behavior in detail: what problems they face, why they can leave, what motivates them to change the category.
- Paying – non-paying, rarely playing – often playing. And we already have four segments, and we can separately influence each of them.
- RFM analysis is only for paying users. You identify different segments of paying users by the frequency of payments, their size, and the prescription of the last payment. Thus, for example, you can select segments of those players who made only one payment, then divide them into those who made it a long time ago (and most likely will not pay anymore) and recently (and you need to encourage them to make a second payment). Another example of a segment obtained by RFM analysis is outgoing whales: those who have paid a lot and often, but have not been paying lately. We need to figure out what’s going on, and by all means bring them back into the game – these are exactly the users who feed you.
- Segmentation by Bartle. The same division of players into achievers, killers, socializers, explorers. There is already a lot written about it, we will only recommend an article that describes well how to single out these players and what to do with them.
And these are not all possible ways of segmentation. You can segment by country, language, device, by completed / unfulfilled event, by traffic source – everything is limited only by your imagination and common sense.
The original material appeared on the pages of Apptractor.

