The St. Petersburg startup ChartLight has officially launched an analytical service of the same name, the main feature of which is the ability to show all types of retention, as well as the frequency and duration of sessions of users of third-party Google Play applications.
Important note: to monitor all these values, the service does not need integration into a particular application.
How can I use ChartLight?
Look, for example, you are making a farm and want to know what indicators are considered the norm among leaders. And instead of posting a post on Facebook, encouraging colleagues to share their experience, you just need to launch a service on the basis of which you can quickly build the following sign:
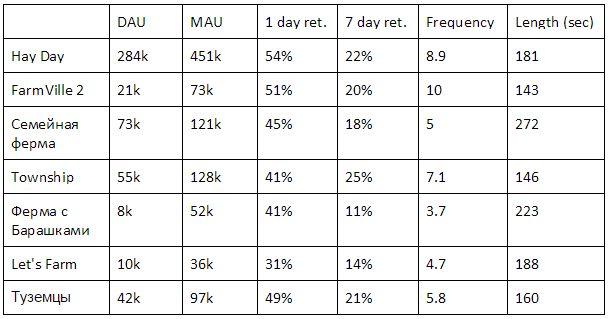
But here it is necessary to make a reservation that ChartLight at the moment does not yet know how to split data by region and now only provides total data for four countries (Russia, Ukraine, Belarus and Kazakhstan). In relation to them, the above data is relevant.
In addition to demonstrating retention, the service currently offers the top in terms of the size of the active audience both in general and in sections of Google Play. As stated in the official press release, “based on the analysis of the rating of applications, customers of the service can choose the most promising areas for their new projects.”
The ChartLight data source is “a library that integrates into applications and collects information about user application launches and installations.”
Website address – chartlight.org