GameAnalytics named the most common mobile game genres, and also told whether retention, session size, ARPPU and the “stickiness” of the project depends on the genre.
Last week, the analytical platform GameAnalytics published a study of Mobile Gaming Benchmarks, which analyzes the genres of mobile games.
The most common genres of mobile games
GameAnalytics learns about the genre of the game when it is registered by the developer on the platform. Based on the data obtained, the company was able to find out which games are most on the market today.
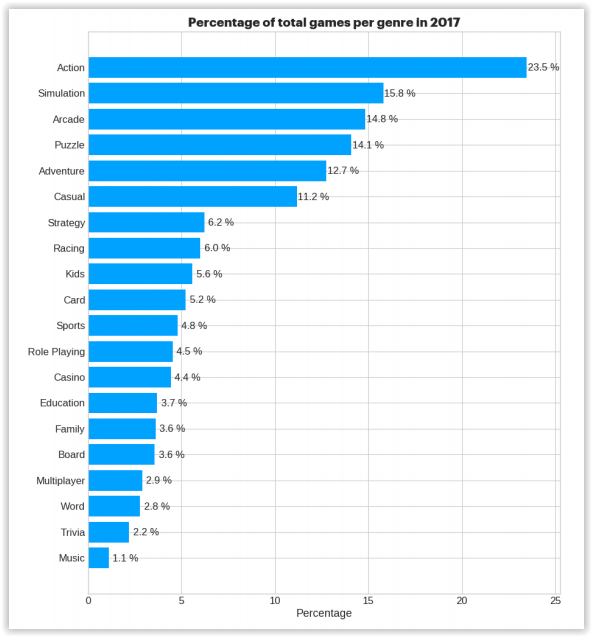
Distribution of the total number of games by genre (2017)
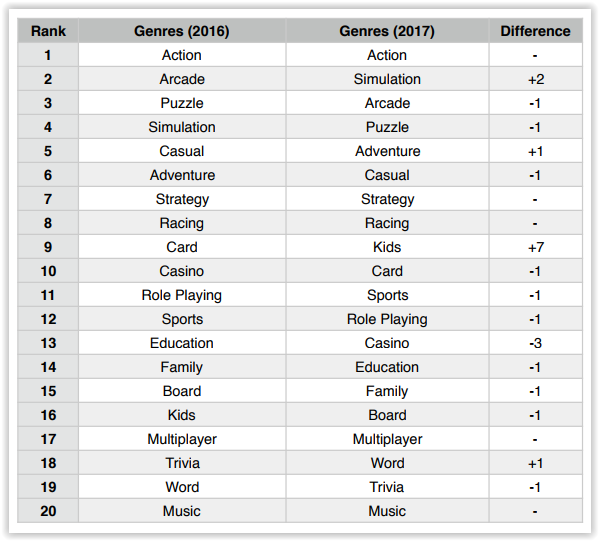
The situation changes slightly every year.
Some genres get more projects, others less. For example, children’s apps (Kids) have become much more popular in 2017.
The dynamics of the popularity of genres by the number of games on the market
The uncompromising leader in the number of projects remains the genre of action products (Action).
Both in 2016 and in 2017, more than 20% of the gaming titles presented on the mobile market are behind him. At the same time, its share among other genres has grown the most in recent years.
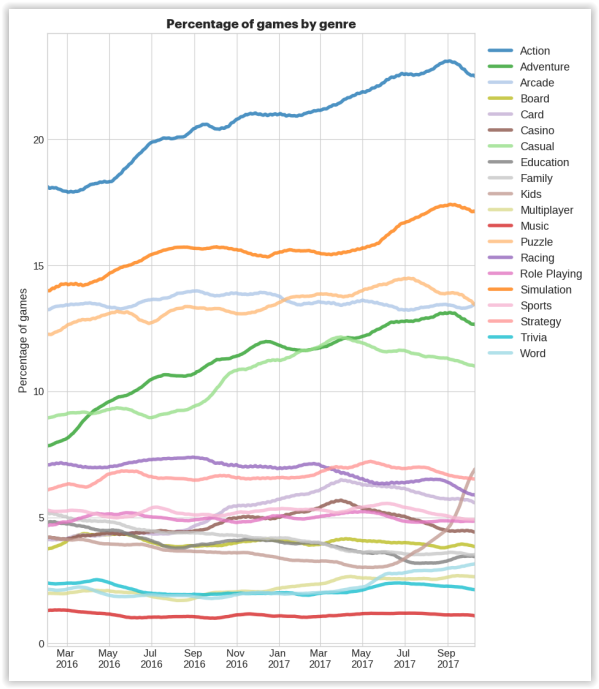
Dynamics of the distribution of games by genre
But, for example, the share of racing games relative to other genres fell from March 2016 to September 2017, as did the share of Family games.
This trend was also true for children’s games until May 2017, when, according to GameAnalytics, they began to boom.
Seventh Day Retention
The most important indicator – retention – is considered in GameAnalytics in a classic way: divide the number of active users on the seventh day after installation by the total number of those who installed the game on the first day (that is, we have a situation where N users downloaded the game on a certain day (X), on the seventh day only one of them remained active part (Y). To find out the retention of the project, we need to divide Y by X).
GameAnalytics counted and compared the retention of genres only on the seventh day. Despite this, she came to curious conclusions.
It is believed that the retention rates that are good for the project are as follows:
- Day 1: 35-40%
- Day 3: 20-25%
- Day 7: 15%
- Day 30: 5%
But in fact, only the top 16% of projects can boast that in their games the retention of 7 days is more than 10%. Among all games, it is 4%.
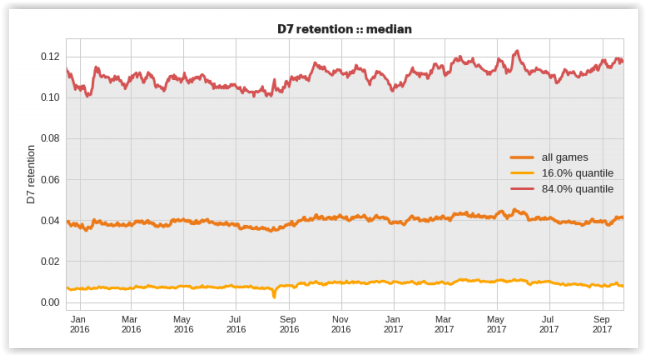
Comparison of 7-day retention between the top 16% of games, median and games with the lowest parameter value
Word games, social casinos, card projects and Board games show the best retention.
Action products and Adventure have very low indicators. Children’s games have the worst metrics.
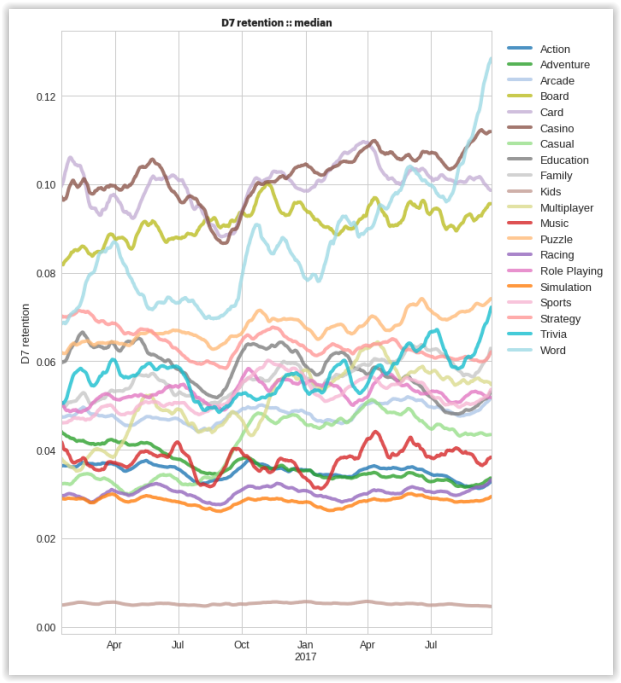
Dynamics of the distribution of the average retention of 7 days by genreSession size in mobile games
The average session size in mobile games is 6 minutes. But in the top 16% of projects, it reaches 11.5 minutes. But there is a caveat: how much a player spends on average in the project depends on the time of year.
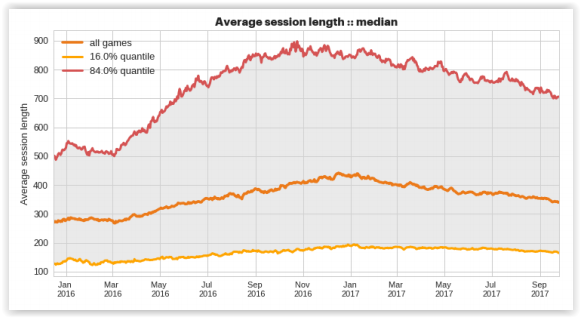
Comparison of the average session value between the top 16% of games, median and games with the lowest parameter value
Seasonality is especially clearly visible if you segment the dynamics of changes in the average session size by genre.
The graph below clearly shows how the time spent in the game varies depending on the season and genre. It is also clear that the session reaches its peak in December-January.
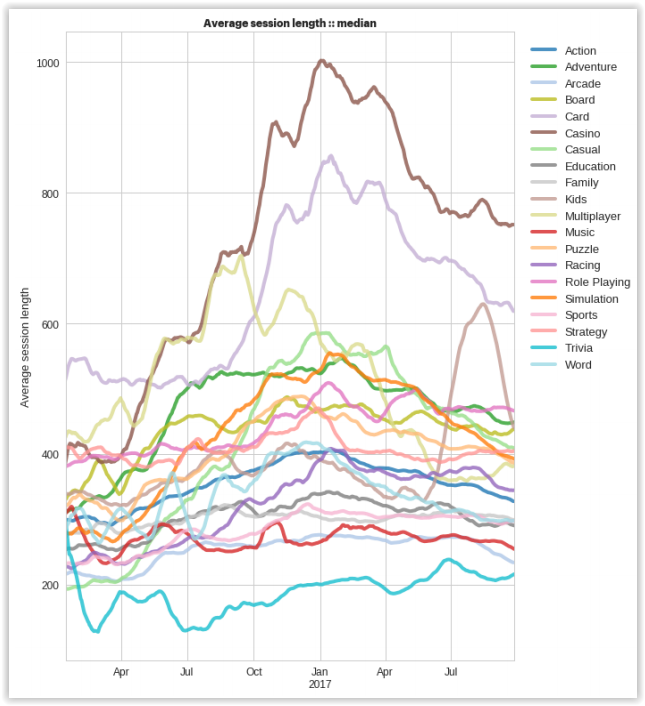
Dynamics of the distribution of the average session size by genre ARPPU in mobile games
One of the most important metrics for business is how much the user leaves in the product, who was still ready to part with his money.
According to GameAnalytics, the income from the average paying player in the top 16% of games in the summer of 2017 fluctuated around $ 50. In a year and a half, it has grown significantly. In January 2016, it was $30.
The value of ARPPU for all games has not changed much over the years. It was $5-7, and it is still at this level.
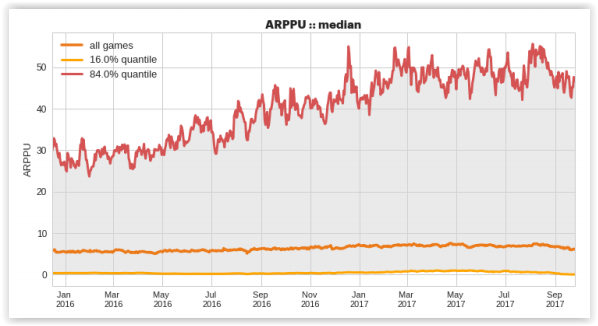
Comparison of ARPPU between the top 16% of games, median and games with the lowest parameter value
The ARPPU schedule, broken down by genre, is the noisiest, but, as the report notes, it is quite possible to find a positive side in this.
While the difference between the top and all titles on earnings varies seriously, there is no such difference in profitability between genres. It depends more not on what type of game you decide to make, but on the quality of gameplay and monetization. However, it is obvious that despite this, it is best to earn from users from strategies (Strategy).
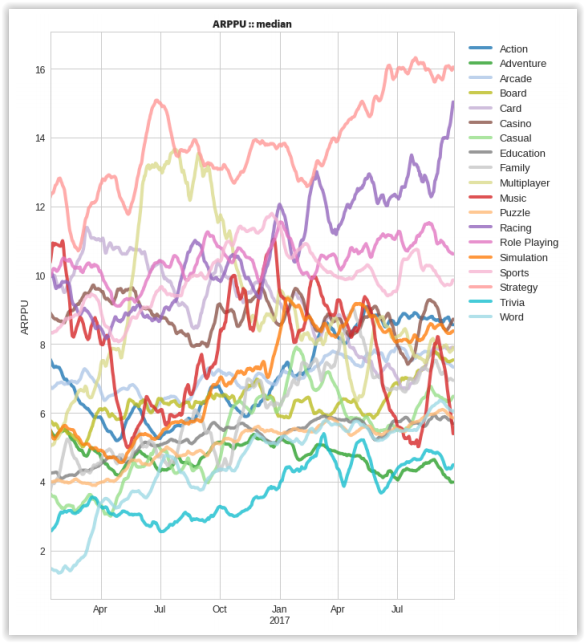
Dynamics of ARPPU distribution by genre The “stickiness” of mobile games
The basic metric that reflects user engagement in the game is “Stickiness” (Stickiness or Sticky Factor). It is usually measured as the ratio of the number of active users per day (DAU) to the number of active users per month (MAU).
As in the case of ARPPU, the graph below shows that the “stickiness” of top projects only grows over time, but both the average value for the market and the value for the weakest projects stagnates.
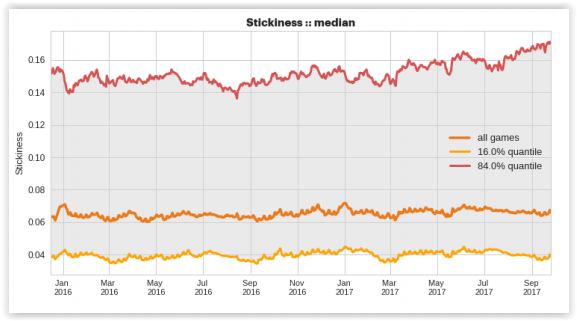
Comparison of the amount of “stickiness” between the top 16% of games, median and games with the lowest parameter value
In general, the “stickiness” of the top 16% of projects is 2 times higher than the market average.
The most “sticky” genres are social casinos, card projects, table and word games. They have it from 14% to 16%. For most other genres, the average value of this metric does not even reach 10%.
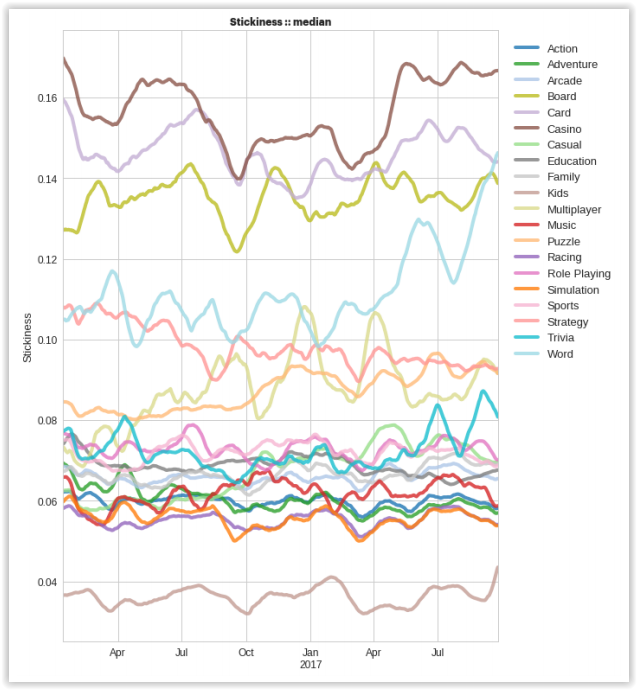
Dynamics of the distribution of “genres” by genre How did the research go?
In total, the company has data on 40 thousand titles. Analysts took active titles for the period from January 2016 to September 2017 for the most popular genres. So they got a base of 12 thousand games. Projects with less than 100 DAU were removed from this collection. For the remaining ones, we looked at the indicators.
Important: 80% of the games in the selection belonged to five genres: Action, Arcade, Simulation, Puzzle and Adventure.
Source: GameAnalytics