Playkot explained why user segmentation is needed and how it should be carried out correctly.
Art: “Knights: Battle of Heroes”
The use of analytics tools in game services (it does not matter whether it is a browser, client, social or mobile solutions) has long been not even a standard, but a first necessity, since only monitoring and evaluating user behavior can act as feedback in massive multi-user projects, as well as an indication of further development of the project, including or another direction.
An agreement with such an obvious thesis, unfortunately, does not always solve the problem. Integrating analytical packages, obtaining data and beautiful graphs, in general, collecting statistics on the project itself does not lead to transparency of the game.
How to make the data obtained useful, we were told by the employees of the St. Petersburg company Playkot, whose “SuperCity” social network Facebook recognized as one of the best new games last year.
Why do we need segmentation?
Data collection on the project can be done in different ways. Most often, when talking about the key indicators of a particular game, they cite classic business metrics, such as ARPU, LTV, retention, and so on. Of course, it is necessary to evaluate the success of the project according to them. But that’s where their role ends. Business metrics can be quite compared with body temperature: the forehead does not burn, so everything is fine with the project. But in the event that the forehead is covered with perspiration, the only conclusion that can be made is that there is something wrong with the game.
“You can‘t get specific solutions for game design out of business metrics,” Lyubov Penyugalova, an analyst at the company, explains to us. – “Common points need to be tied to specific features in the game.”
Lyubov advises moving from business parameters to real ones through segmentation of users, which will then allow categorizing their behavioral patterns. This is done primarily in order to get, firstly, a clear understanding of who our players are, and secondly, to be able to make point decisions on changes in gameplay, focusing, for example, on a low-paying audience or whales: different types of players need to be served different types of goods or offers on a platter.
Without segmentation, the reaction of users to any change in the project is impossible not only to explain, but also to simply identify. More precisely, it is possible, but only at the general, business level in terms of final indicators.
Segmentation, in turn, allows you to see the reaction of specific groups of users to each decision in the design of the game. And since we get the opportunity to see the reaction at a similar level, it means that we get a point adjustment tool in our hands.
How is segmented in Playkot?
Segmentation in Playkot occurs by dividing players into groups, based on how certain users play.
“We look at the past experience of how users played, we break them into groups, and then we give out some specifics to these groups on game design or on monetization features,” explains Lyubov.
Segmentation is carried out as part of the joint work of analysts and designers who form a list of key parameters of the players of a particular game.
“If we are talking about a system of segments, then it is necessary to go from a specific product,” says Lyubov.
There is no segmentation universal for all projects. That is, in each specific case (with each individual new game), the analyst and the designers will have to gather at the same table in a new way.
At the same time, there are things on analytics that work on all projects in approximately the same way, which, for example, do not need to be changed if, after developing a time manager, you have taken up a game, for example, in the “three-in-a-row” genre.
First of all, it is a payment monitoring system. It is more or less universal for all types of games.
“We have in-game currency everywhere, we have goods, and everything about payments and in-game purchases is pretty identical. It doesn’t matter whether it’s a casual, hardcore or midcore game, the idea of payments is the same everywhere, of course, it may differ in terms of average output indicators, but no more,” Love reveals.
But outside of payment monitoring, it will not be possible to universalize the segmentation system within projects. More precisely, it will work, but only if the projects in fact differ little from each other. But even in this case, the segmentation will need to be constantly refined.
Segmentation case by “Knights”
In the social project “Knights: Battle of Heroes”, Playkot identified three groups of segments: payment, additional and activity segments.
1. Payment segments
Dividing players into groups based only on how they pay. But not just dividing by users by the amount of the amounts they contribute, but based on a wider range of closely related variables. By themselves, these factors are not self-sufficient, but when compared with each other, they allow you to answer key questions about the project.
Learn more about these factors and why they are important:
The size of the first payment – the distribution of users by the size of the first payment allows you to see how, for example, the minimum payment plays an important role in the game, which is often considered psychologically important for players. Knowing the amount of the first payment, you will also be able to answer how long users, having paid a lot in the game at once, remain in the project.
The level of the first payment – at what level of progress the user makes the first payment. It is known that players react differently to different types of stimulation (pay). By placing different stimuli on different progress segments, players can be segmented by the types of stimuli they respond to.
The player’s payment amount (LTV) is a traditional measurable characteristic that allows you to separate “whales” from “dolphins” and other “fish”.
The average payment is another traditional business metric, which, for example, as part of a comparison with LTV, will allow you to segment the same group of “whales”: to separate those players who are used to throwing a lot into the game at once, but not the fact that they are ready to stay in it, from users who have invested in the project the amount of the same order, but not immediately, but for a long time.
The number of payments – as well as the average payment allows you to understand the user’s payment pattern. Frequent microtransactions lead to the fact that we can offer such a user additional promotional discounts for small amounts. Mechanics fairly works in the opposite direction with large payers.
Days from the last payment – this feature allows you to single out users who stop paying, among other things. That is, those who began to lose interest in the game. As Lyubov noted, usually between this event and leaving the game, developers have two weeks to return similar players (or transfer to another application).
The six characteristics described above formed the basis for segmenting players and identifying payment segments. I would like to note separately that each cluster is characterized by each of these six factors, so we know almost everything about each of the groups regarding their payments and can accordingly target our products, price tags or even individual game mechanics separately for each of the groups.
The segments themselves turned out to be as follows (the values of the averages are adjusted by an indefinite coefficient to preserve trade secrets):
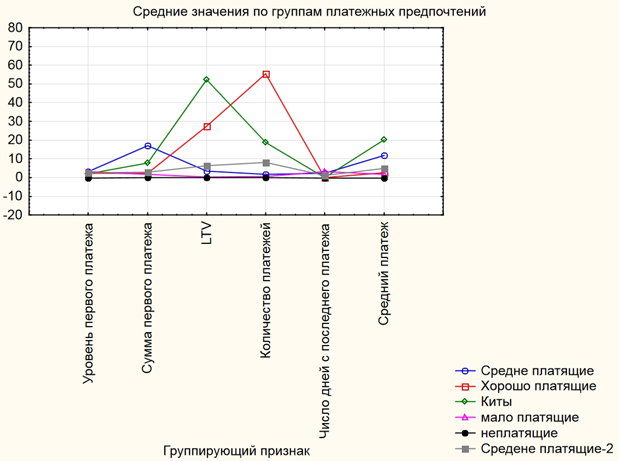
Each line on the graph is a separate cluster that has a value for each of the factors. You can immediately see the whales on the chart, you can see an interesting segment of average payers who immediately throw a lot of money into the game with the first payment, and you can also see well-paying ones who pay less whales, but at the same time make 100500 small transactions.
Subsequently, out of six groups for game design, they decided to leave four.
2. Segments by activity
It allows you not just to divide players into active and not so active, but to identify why and when they go there, how involved they are in the project, at which levels they are more active, at which less, and so on
The indicators on the basis of which the segments were formed were selected as follows:
Player level – actually, how things are with progress, segment users by their progress at the moment and in general.
Number of visits – the number of openings of the application window.
Active days in the game – how many days the player directly logged into the game. With the help of this segment, you can separate hardcore players who are running fast on the project, devoting a lot of time in the game, from those who are slower.
Activity coefficient – the ratio of active days in the game and days since installation. If there is one, then he comes in every day, he is very involved, he likes everything. In other analytics, this parameter helps to calculate business metrics in the context of user activity.
Days since the last entry into the game – with the help of this segment, among other things, it is possible to identify a critical number of days of absence from the game, after which the user will most likely not pay in the game. For the Knights project, this number turned out to be 5 days.
The segments themselves, based on the above factors, turned out to be 5, but two of them eventually decided to combine. The graph shows the average values for each of the characteristics (the data are statistically normalized to avoid excessive influence of individual indicators, so it turns out a seemingly impossible negative value for indicators).
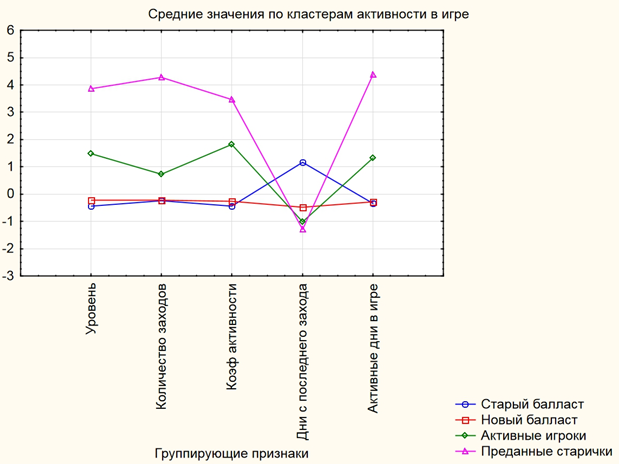
“Not quite the correct use of the word “ballast” in relation to users, nevertheless, very accurately reflects their pattern of activity: you can still try to do something with the new ones that have fallen off (send a notification or an e-mail invitation), but there is no point in working with the old ballasts,” notes Lyubov.
3. Additional segments
In addition to the payment segments and groups related to activity, segments were also identified according to what players like to do in the game more (pump up warriors or develop an economic base, go to pvp or fight in missions), factors such as:
- Wins/losses – the ratio of the number of PVP, arenas and missions won to those lost. The higher, the more skilled the player is in the tactical ability to fight, more accurately assesses his strength before the battle and the more advanced his troops are.
- Rating – the rating of getting into the league (laurels).
- Economic development – the development of the player’s base.
- Active friends – the number of active friends of the player.
Based on this, the following segments were obtained: social players, warriors, builders and ballast.
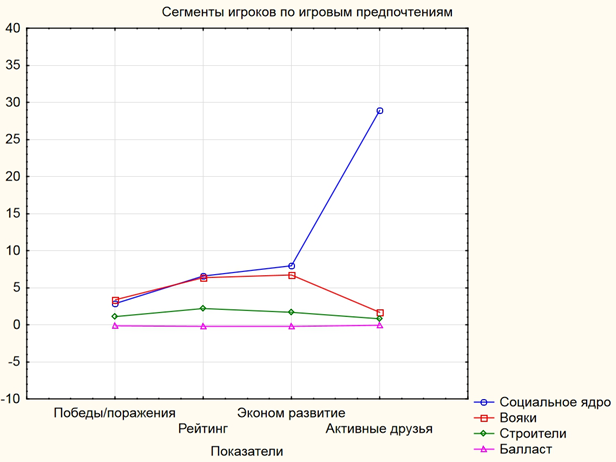
“From the proposed schedule, it is not obvious why the red line is the warriors, and the green line is the builders, although the warriors for economic development are all “blooming and smelling.” The reason lies in the fact that if a player builds a lot and fights a little (green line), then this is definitely a user focused on pumping the base, i.e. his base development is for the sake of development itself, and not for the sake of winning battles a lot and successfully. Warriors, on the contrary, put fighting (and combat rating) in the first place and economic development for them is only a tool necessary for victories. Accordingly, for some and others, different types of goods in the game are interesting, different mechanics can be targeted at them and monetization schemes covering one and the other can be purposefully developed,” explains Lyubov.
The task of segmentation is not to try to cover all possible patterns of behavior, but to make sure that within the framework of the selected variables, the model system can demonstrate the largest patterns, under which it is already possible to consciously make changes to the application itself.
As an example of how such a system can work, Love has given us this situation. Within the payment segments, comparing LTV and the average payment made in the game, four (former six) clusters were identified:
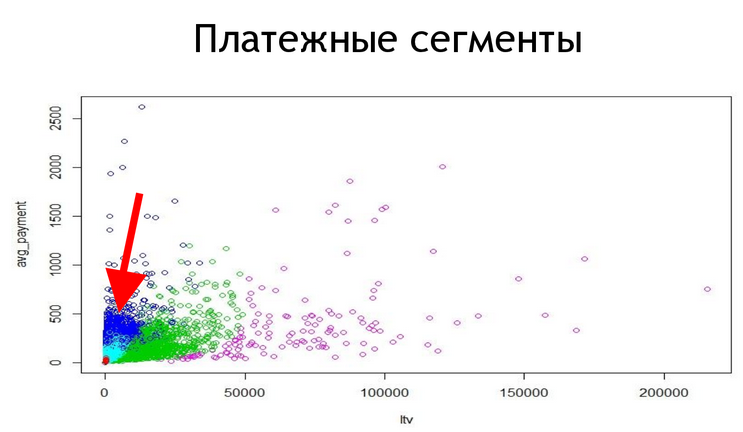
- Blue – those who pay very little;
- Green – those who pay very little and whose LTV eventually does not reach high marks;
- Purple – those who make small payments, but have paid so much;
- Blue – those who pay a lot at once, but for some reason not for long.
The “blue” cluster turned out to be problematic. These were very desirable users for the game (they were immediately ready to deposit large amounts), but for some reason they did it only for the first time. By highlighting the problem, analysts were able to find out what kind of users they are, at what stages they fall off, and solved the problem.
This was solved, among other things, through monitoring according to the scheme of player transitions by segments.
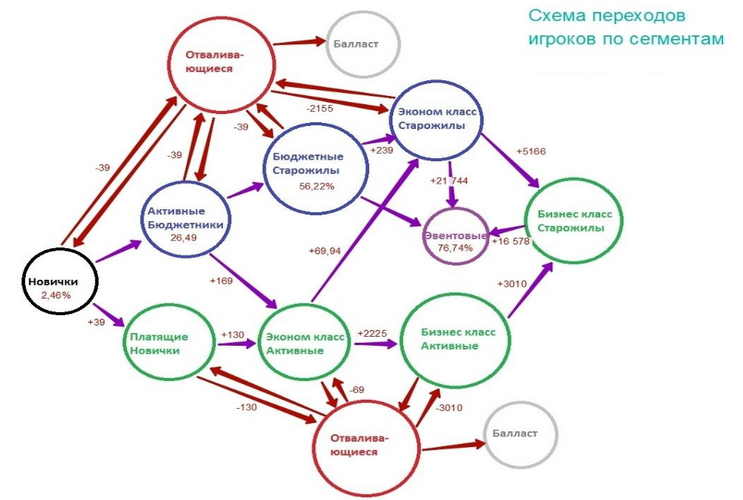
In other words, there was information that well-paying players and whales were falling out of the game at 20-30 levels. A separate “cloud” was allocated for them in the scheme, which was monitored. A change was made to the game, we looked at the state of payments: whether it increases, decreases, where they leave it or where they come from, and so on.
Segmentation also allowed, for example, to build payment schedules broken down by payer types.
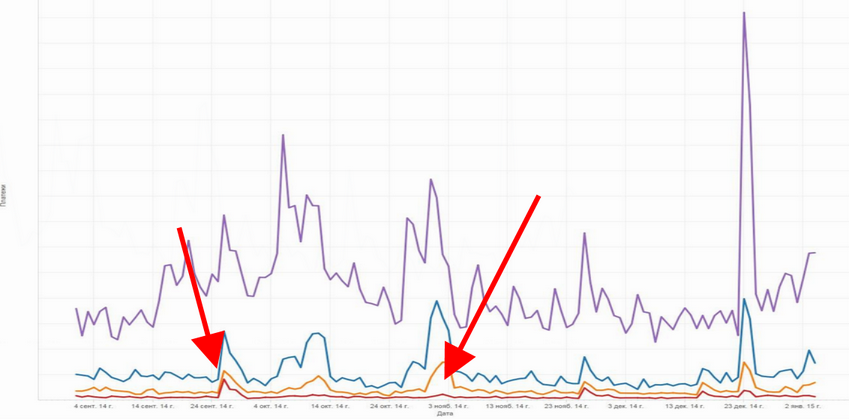
It was possible to see how users belonging to different groups reacted to different types of content (whether they bought or not). It turned out that they can react in different ways. The fact that whales were actively buying up left other groups of payers indifferent. This was also true for those players who were at the “other pole”.
***
Despite the fact that the described segments seem, at first glance, general, suitable for a wide range of products, they were chosen strictly based on the needs and, what is also important, the capabilities of Playkot. Therefore, it seems to us that they are perfectly suitable only as a sample, but not as a practical guide for segmenting your own projects. Whereas the approach to cluster formation described above can really be adopted by other companies.
The author expresses gratitude to the Playkot team and personally Lyubov Penyugalova for their help in writing the material.