At the beginning of 2013, one of the most obvious trends was the growth of Asian markets. Today, this is no longer a trend, but a given. Distimo told about the dynamics of Asian dragons over the past year.
The key results of the study, which the company shared yesterday, are as follows:
1. Asia is currently the most profitable mobile app market. Last December, it accounted for 41% of all global revenue. For comparison, the USA generated 31%, and Europe – 23%.
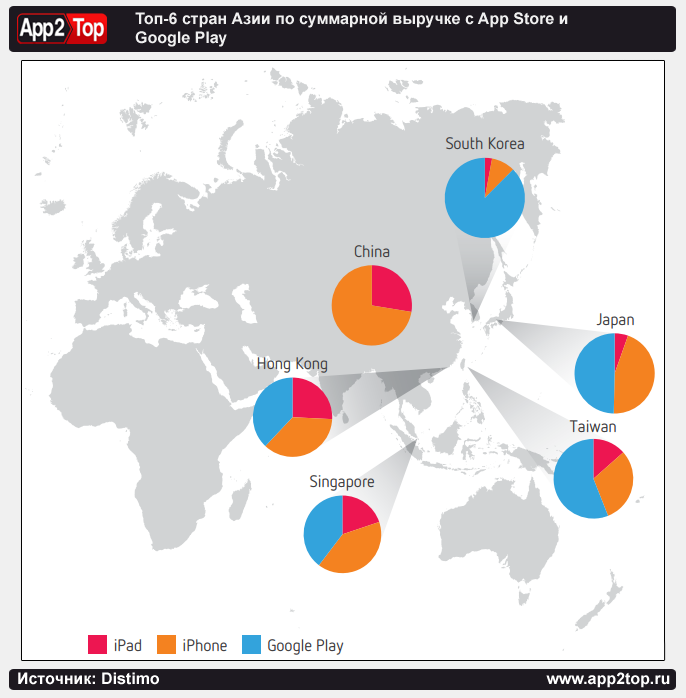
What is important: in terms of revenue in Asia, the platforms are on a par. 50% falls on the App Store, 50% on Google Play (the exception is South Korea, where the market is for Android).
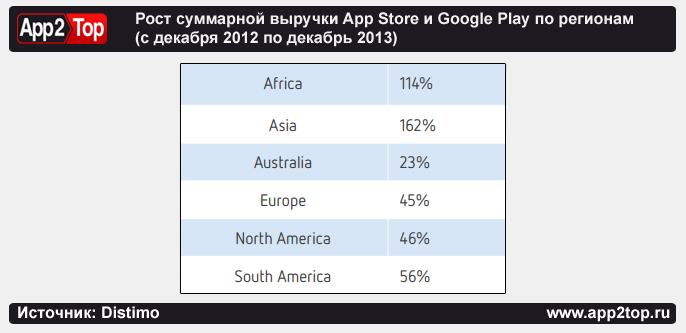
2. From December 2012 to December 2013, revenue in Asia increased by 162%, and in the USA only by 46%.
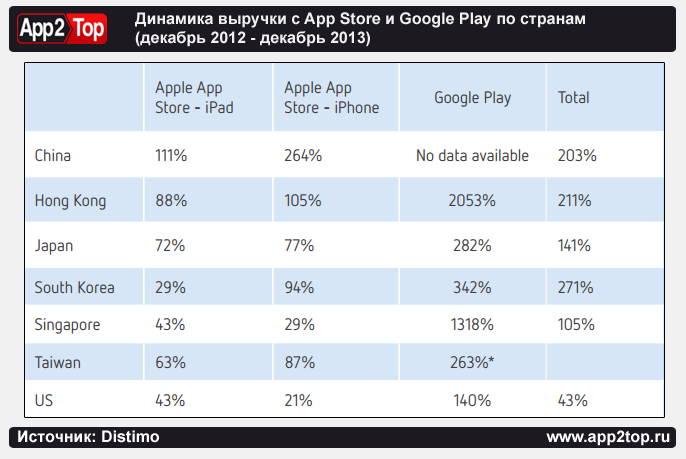
Just below is a table reflecting the dynamics of total revenues from world markets over the past year.
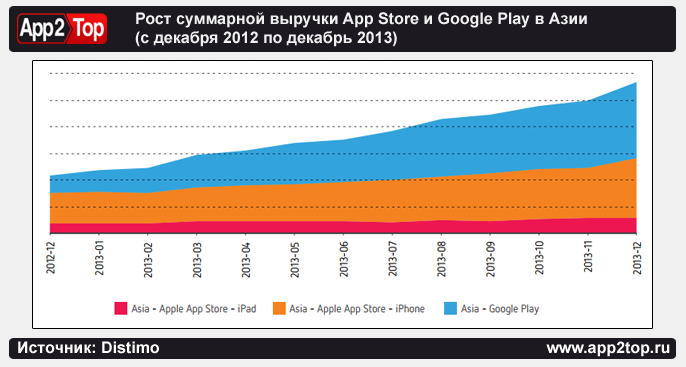
Despite the fact that the App Store and Google Play do not differ in terms of revenue in Asia, their growth dynamics are completely different. If revenue from the official Android market has quadrupled in 12 months, financial receipts from the iPhone have risen “only” by 94%, and from the iPad by a completely frivolous 64%.
3. Japan is the leader in revenue in Asia. It is followed in descending order by: South Korea, China, Taiwan and Hong Kong.
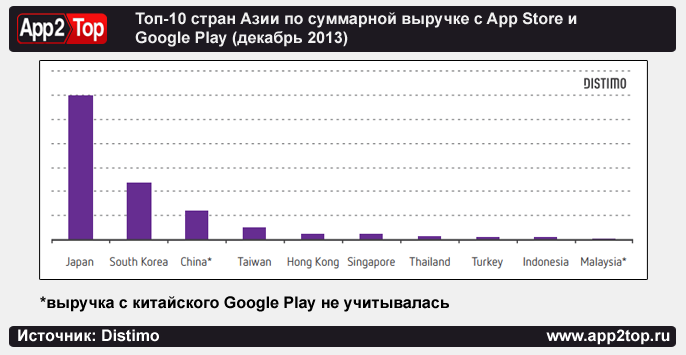
Revenue from the Japanese market is 77 times more than revenue from the Malaysian market.
The distribution of revenue across platforms can be viewed just below.
And here is the dynamics by country and platform.
4. The prevailing business model in the Asian region is freemium.
5. The most downloaded game in Asia in December 2013 was Angry Birds Go!
Out of curiosity: if the percentage of popular local applications in the top 300 US applications ranges from 25% to 32%, then in Japan it ranges from 60% to 72%.
A source: http://www.distimo.com