
The guys from Superdata calculated that in 2014 mobile games will be able to earn a serious amount, namely $ 21.6 billion. The total MAU will be 1.4 billion.
In order to understand the scale of these figures, I propose two comparisons:
- In one 2013, the global box office amounted to $35.9 billion
- At the end of March 2014, there were 7.1 billion people on Earth
In other words, the figures for the mobile market presented by Superdata are comparable both with the annual income of the film industry from the rental of films and with the population of the planet Earth.
However, most news outlets, like the analysts themselves, preferred to focus on comparing the Chinese and American mobile game markets. And here, too, everything is very interesting.
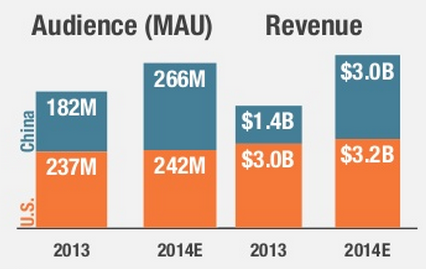
The story is as follows: the Chinese mobile games market has almost caught up with the American mobile games market in numbers. The markets of both countries will have a comparable MAU and a comparable income by the end of this year.
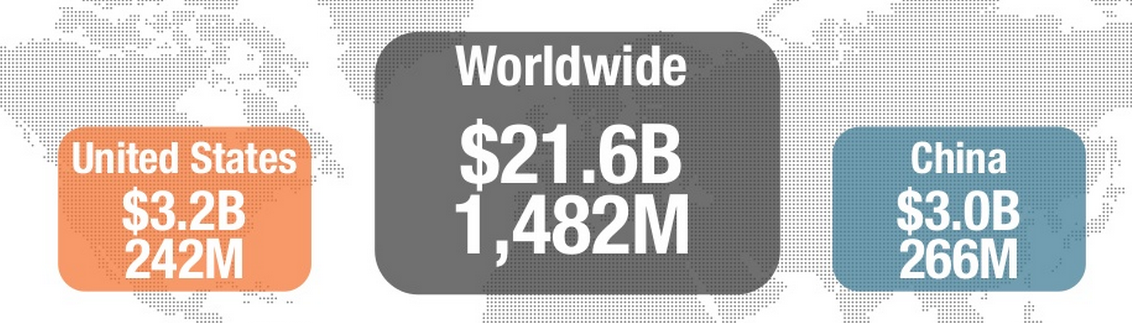
USA
- Market revenue – $3.2 billion
- MAU – 242 million
China
- Market revenue – $3 billion
- MAU – 266 million
This situation has become possible due to a number of opposite trends.
MAU
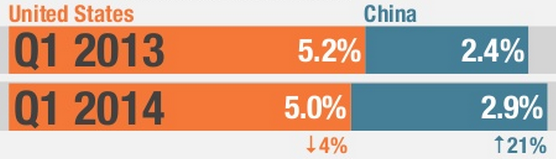
The growth of MAU in the USA is insignificant. This is hindered by the saturation of the market. There is simply nowhere to take new users. The growth in the number of new payers, in turn, begins to slow down against this background. This ultimately affects the conversion rate.
At the same time, in China, firstly, the level of smartphone penetration continues to grow, and secondly, major players are beginning to bring world hits to the local market. A good example is Tencent, which is going to launch Candy Crush Saga in China. Both factors stimulate an increase in the audience and its conversions.
Payments
The growing confidence in payment methods in China is spurring not only the number of payers, but also the average size of their payments. By the way, by the end of 2013, he turned out to be more than the staff. Although, it is clear that if you scale ARPPU to ARPU, then China will have nothing to brag about.
Another important driver of ARPPU’s growth is the proliferation of hardcore and midcore titles.
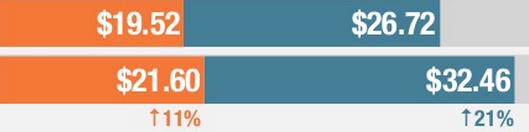
CPI and ARPU
The more or less stable situation in the US and the explosive growth of the Chinese mobile games market quite understandably affect the behavior of CPI and ARPU.
In the USA, the price per installation changed slightly during the first quarter of 2013, the same can be said about its behavior in the first quarter of 2014.
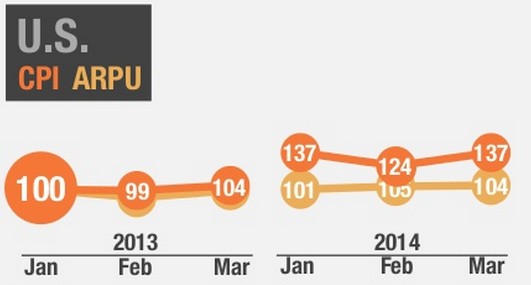
The quarterly ARPU has hardly changed over the year. But this, given the slight drop in conversion and saturation of the market, was expected.
In China, everything is completely different. The values of both CPI and ARPU significantly “jumped”.
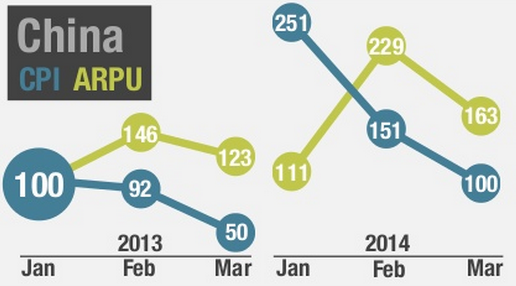
The price of the installation in January 2014 was more than twice as high as in January 2013, but by March 2014 it had fallen to just this value.
In Superdata, the changes that are taking place are explained by seasonal application features.
The Chinese ARPU for the first quarter of 2014 repeats the dynamics of last year, although the values themselves were higher.
This happened due to the growing popularity of casual games. Despite the fact that whales playing midcore and hardcore titles remain the main payers in China, people who are not accustomed to IAP are also ready to invest in simple projects.
***
It is a pity that Superdata did not give specific figures for CPI and ARPU. It would also be interesting to compare them.
A source: http://www.superdataresearch.com