The other day Pixonic published on its website a very interesting material about how to properly evaluate a successful game. With the kind permission of the company, we are posting this article on App2Top.ru .
Often, according to analytics, the task arises to compare projects with each other or the same project at different time intervals. I want to tell you about how we solve this problem at Pixonic. Of course, someone will say: “Loot is the most objective parameter, and it is necessary to compare by income.” But income is a consequence of people’s work not only on the creation of the project, but also on its promotion. And most often it is required to evaluate those projects that have recently been launched and are far from completion.
1.
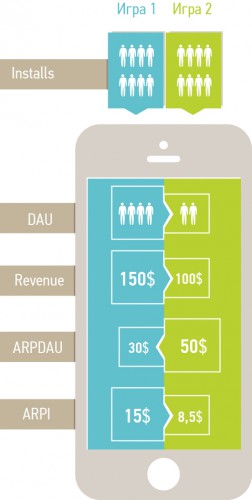
First, it is worth explaining why the comparison of games by ARPDAU is incorrect. Many people evaluate the picture according to this indicator, since it displays income from one active user, ignoring that the chosen metric does not take into account the number of these most active users, which can be small, large or even huge. On the other hand, the indicator takes into account both the average check (ARPPU) and the percentage of those paying, but does not pay attention to conversions of installations to active players (or Retention), so a project with a high ARPDAU may in fact be worse than a project with a low ARPDAU. Therefore, we are looking primarily at the income from the installation (ARPI).
The illustration clearly demonstrates how, with the same number of installations, a high ARPDAU turns out to be for a project with the worst indicators in terms of money and ARPI.
2.
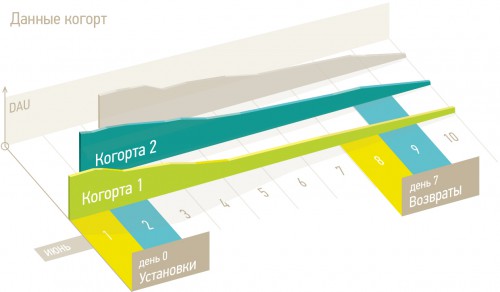
Secondly, you need to understand that it is important to look at cohort indicators, including ARPI, when evaluating. Cohorts are groups of users divided by registration dates, and the indicators for these groups look relative to the day of installation, for example, 7 days after the first launch. For the cohorts of users who installed the game on June 1st and 10th, the indicators on the 7th day of the game should be measured on June 8th and 18th, respectively.
Thanks to this, we can be sure that all players have passed approximately the same “path” in the game by the time the indicators were removed.
3.
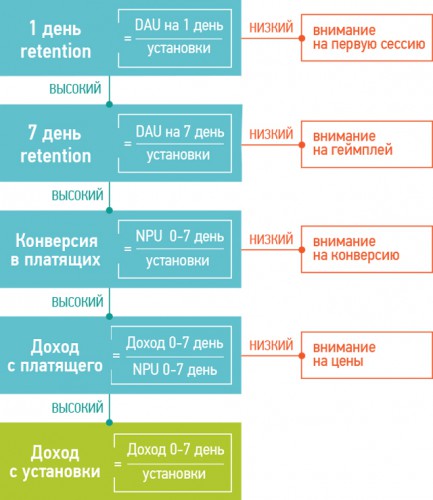
Thirdly, it is important to note that based on the values of the indicators that we provide, the developer must make specific decisions. To do this, we measure not only ARPI by cohorts, but also four other important indicators: the return of players on the 1st and 7th day (Retention 1/7 day), the conversion of installations to paying players and the average income from paying.
Depending on the values of these indicators, we make decisions about the fate of the project and indicate which aspects of the game developers should focus on. Evaluate our algorithm for working with these indicators.
About the author:Igor Klyukin, Chief Analyst at Pixonic.


