Today, analytics helps not only to monitor the effectiveness of applications, but also to find specific weaknesses in the technical component or game design. More about this tells Maxim Kozhnov, CRO Azur Games.

The column is based on Maxim’s speech at the joint Azur Games and Google Ads meetup, which took place in March and was dedicated to the development and monetization of hyper-casual games.

Maxim Kozhnov
Now they often talk about how games are becoming more complex, how the demands of players on the quality and quantity of content are growing.
Behind all this, analytics is also being improved. Below I will tell you how to increase the level of your analytics and move from simple metrics to more complex things (in particular, to tracking and correcting the level of user churn).
First, let’s quickly recall the basic metrics that are known and used by everyone. We can divide them into three groups.
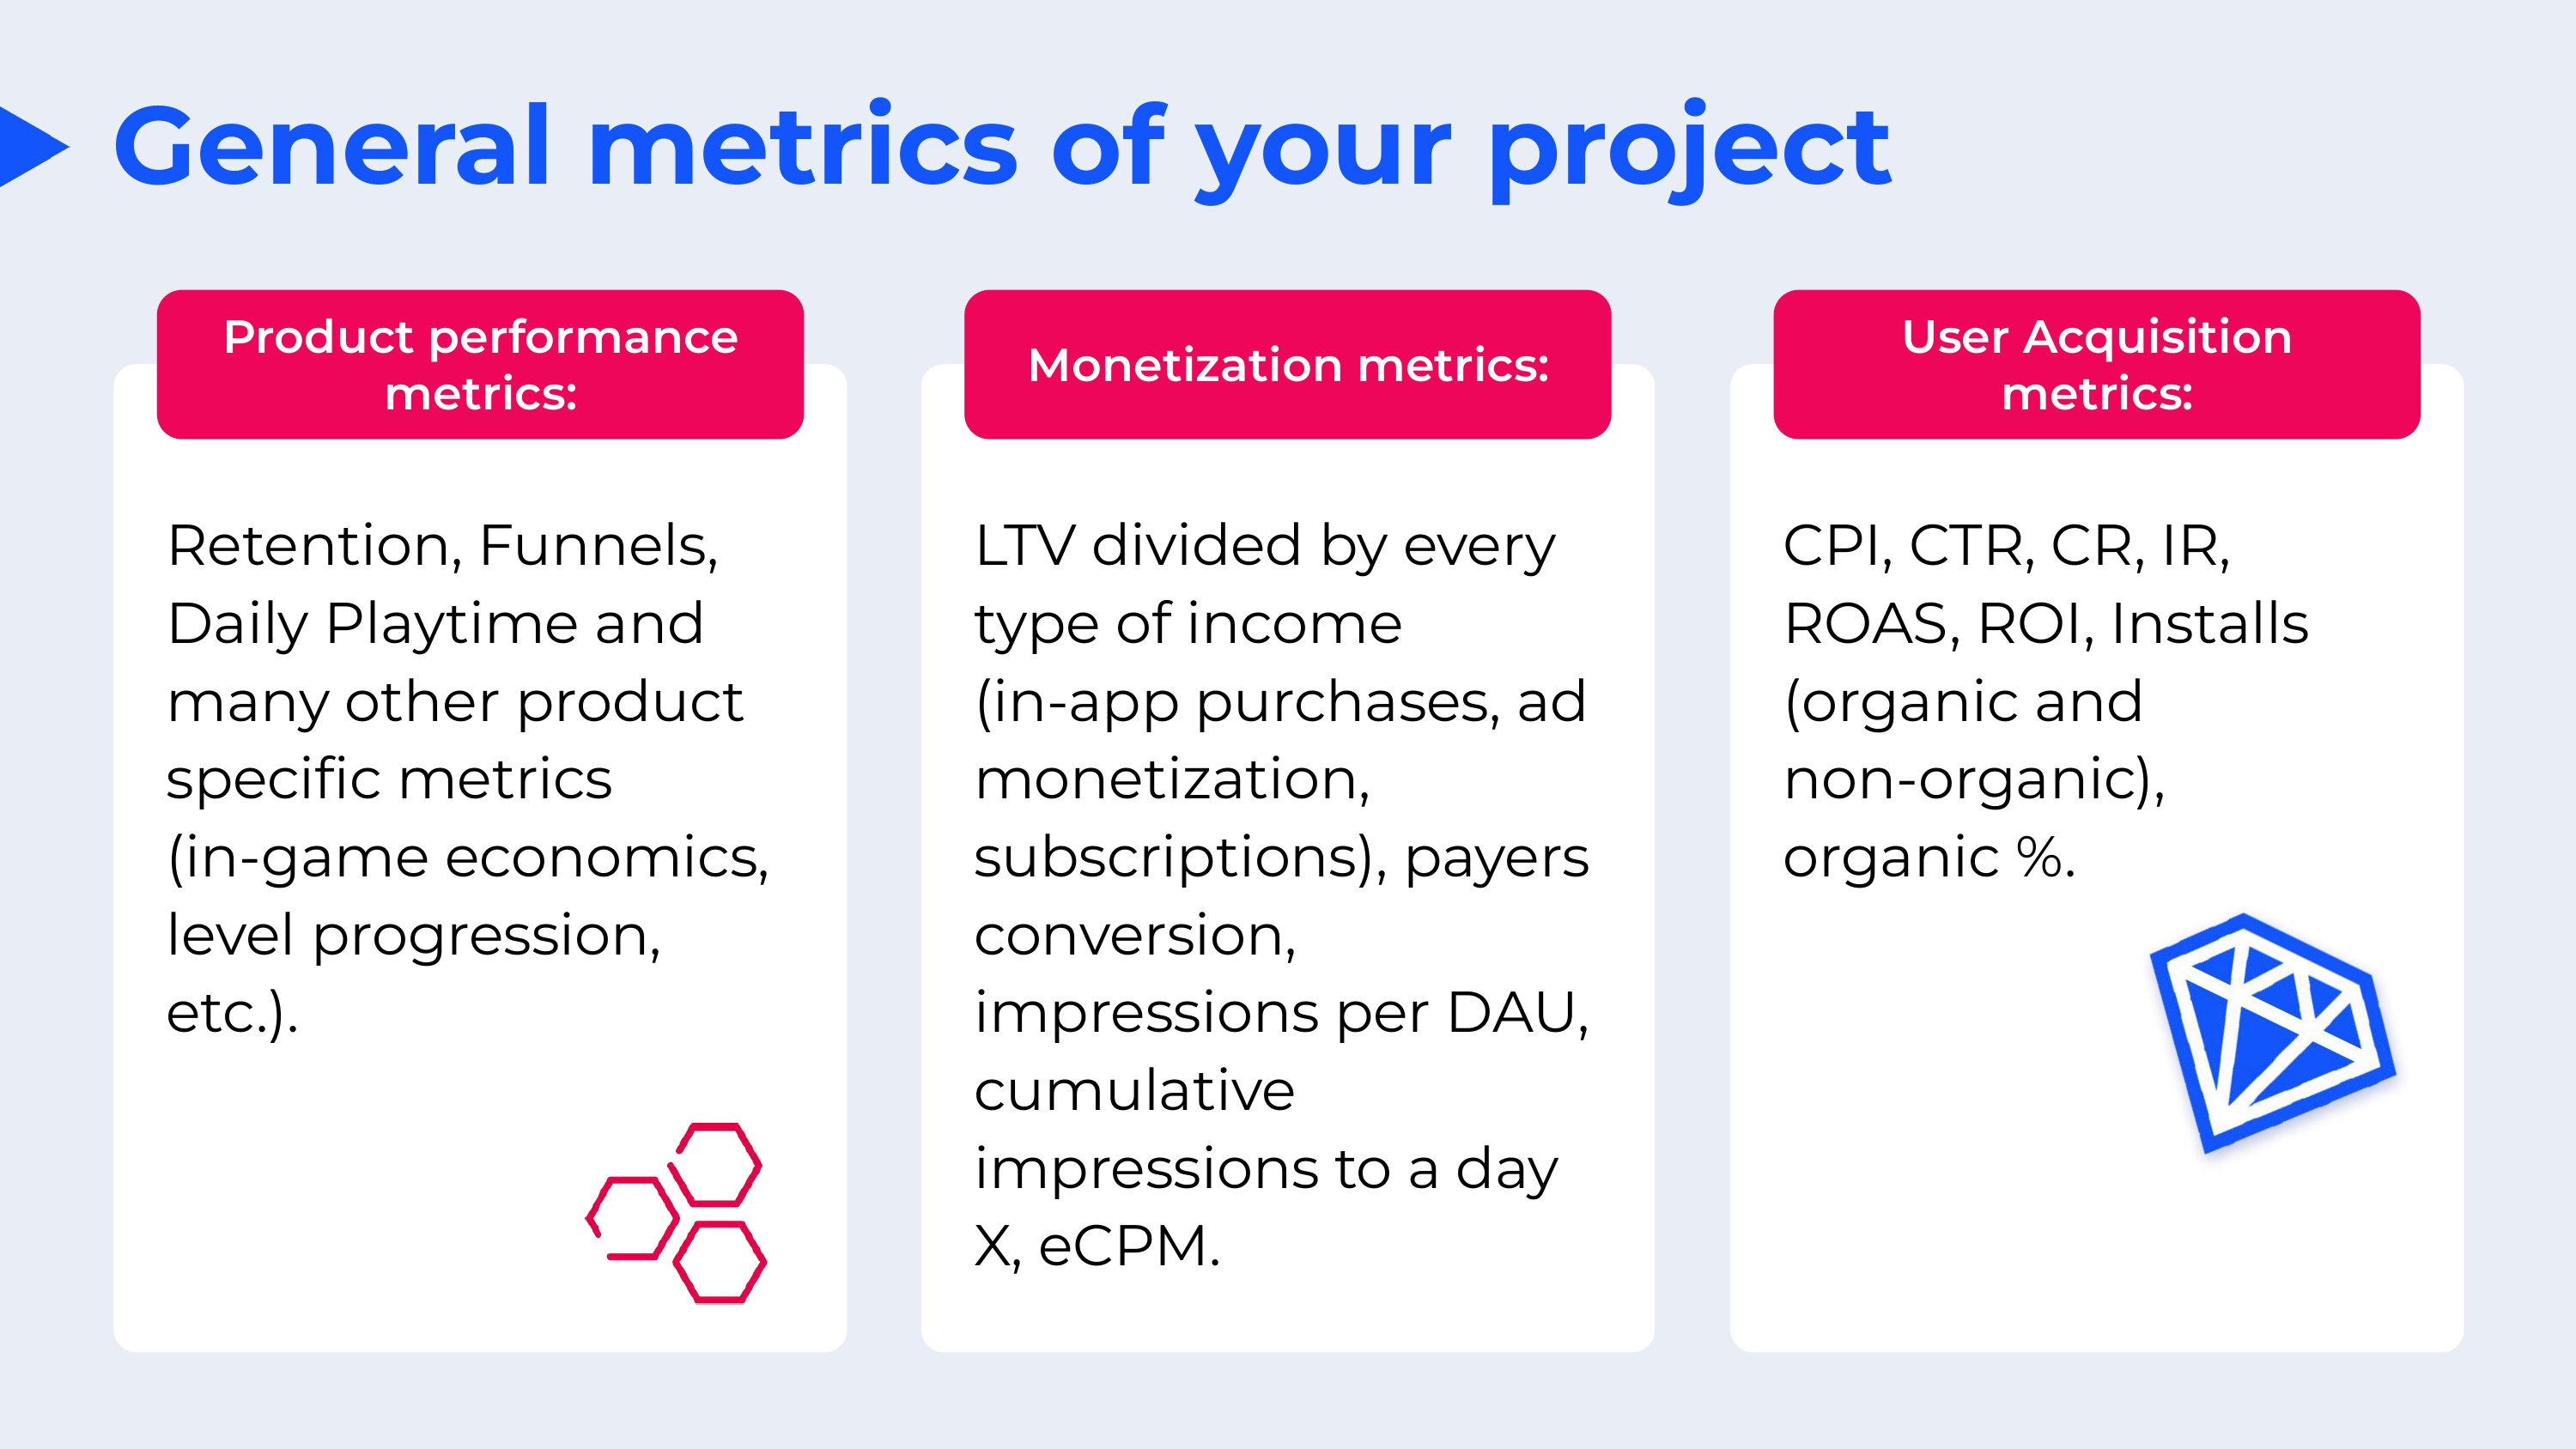
Firstly, these are product metrics, such as retention, playtime and others. It’s hard to add anything here.
The second group is monetization metrics. They can be divided into in-game purchases, advertising monetization and subscriptions. The main metric here, of course, is LTV. We also look at screenings, daily screenings, general screenings for Day X and similar things.
The third group is user engagement metrics (CPI, CTR, conversion rate, install rate, ROI, organic percentage). They’re pretty standard too.
But we must remember that the main metric is always ROI. If it is above 100%, then the project makes a profit. This can be achieved in many ways.
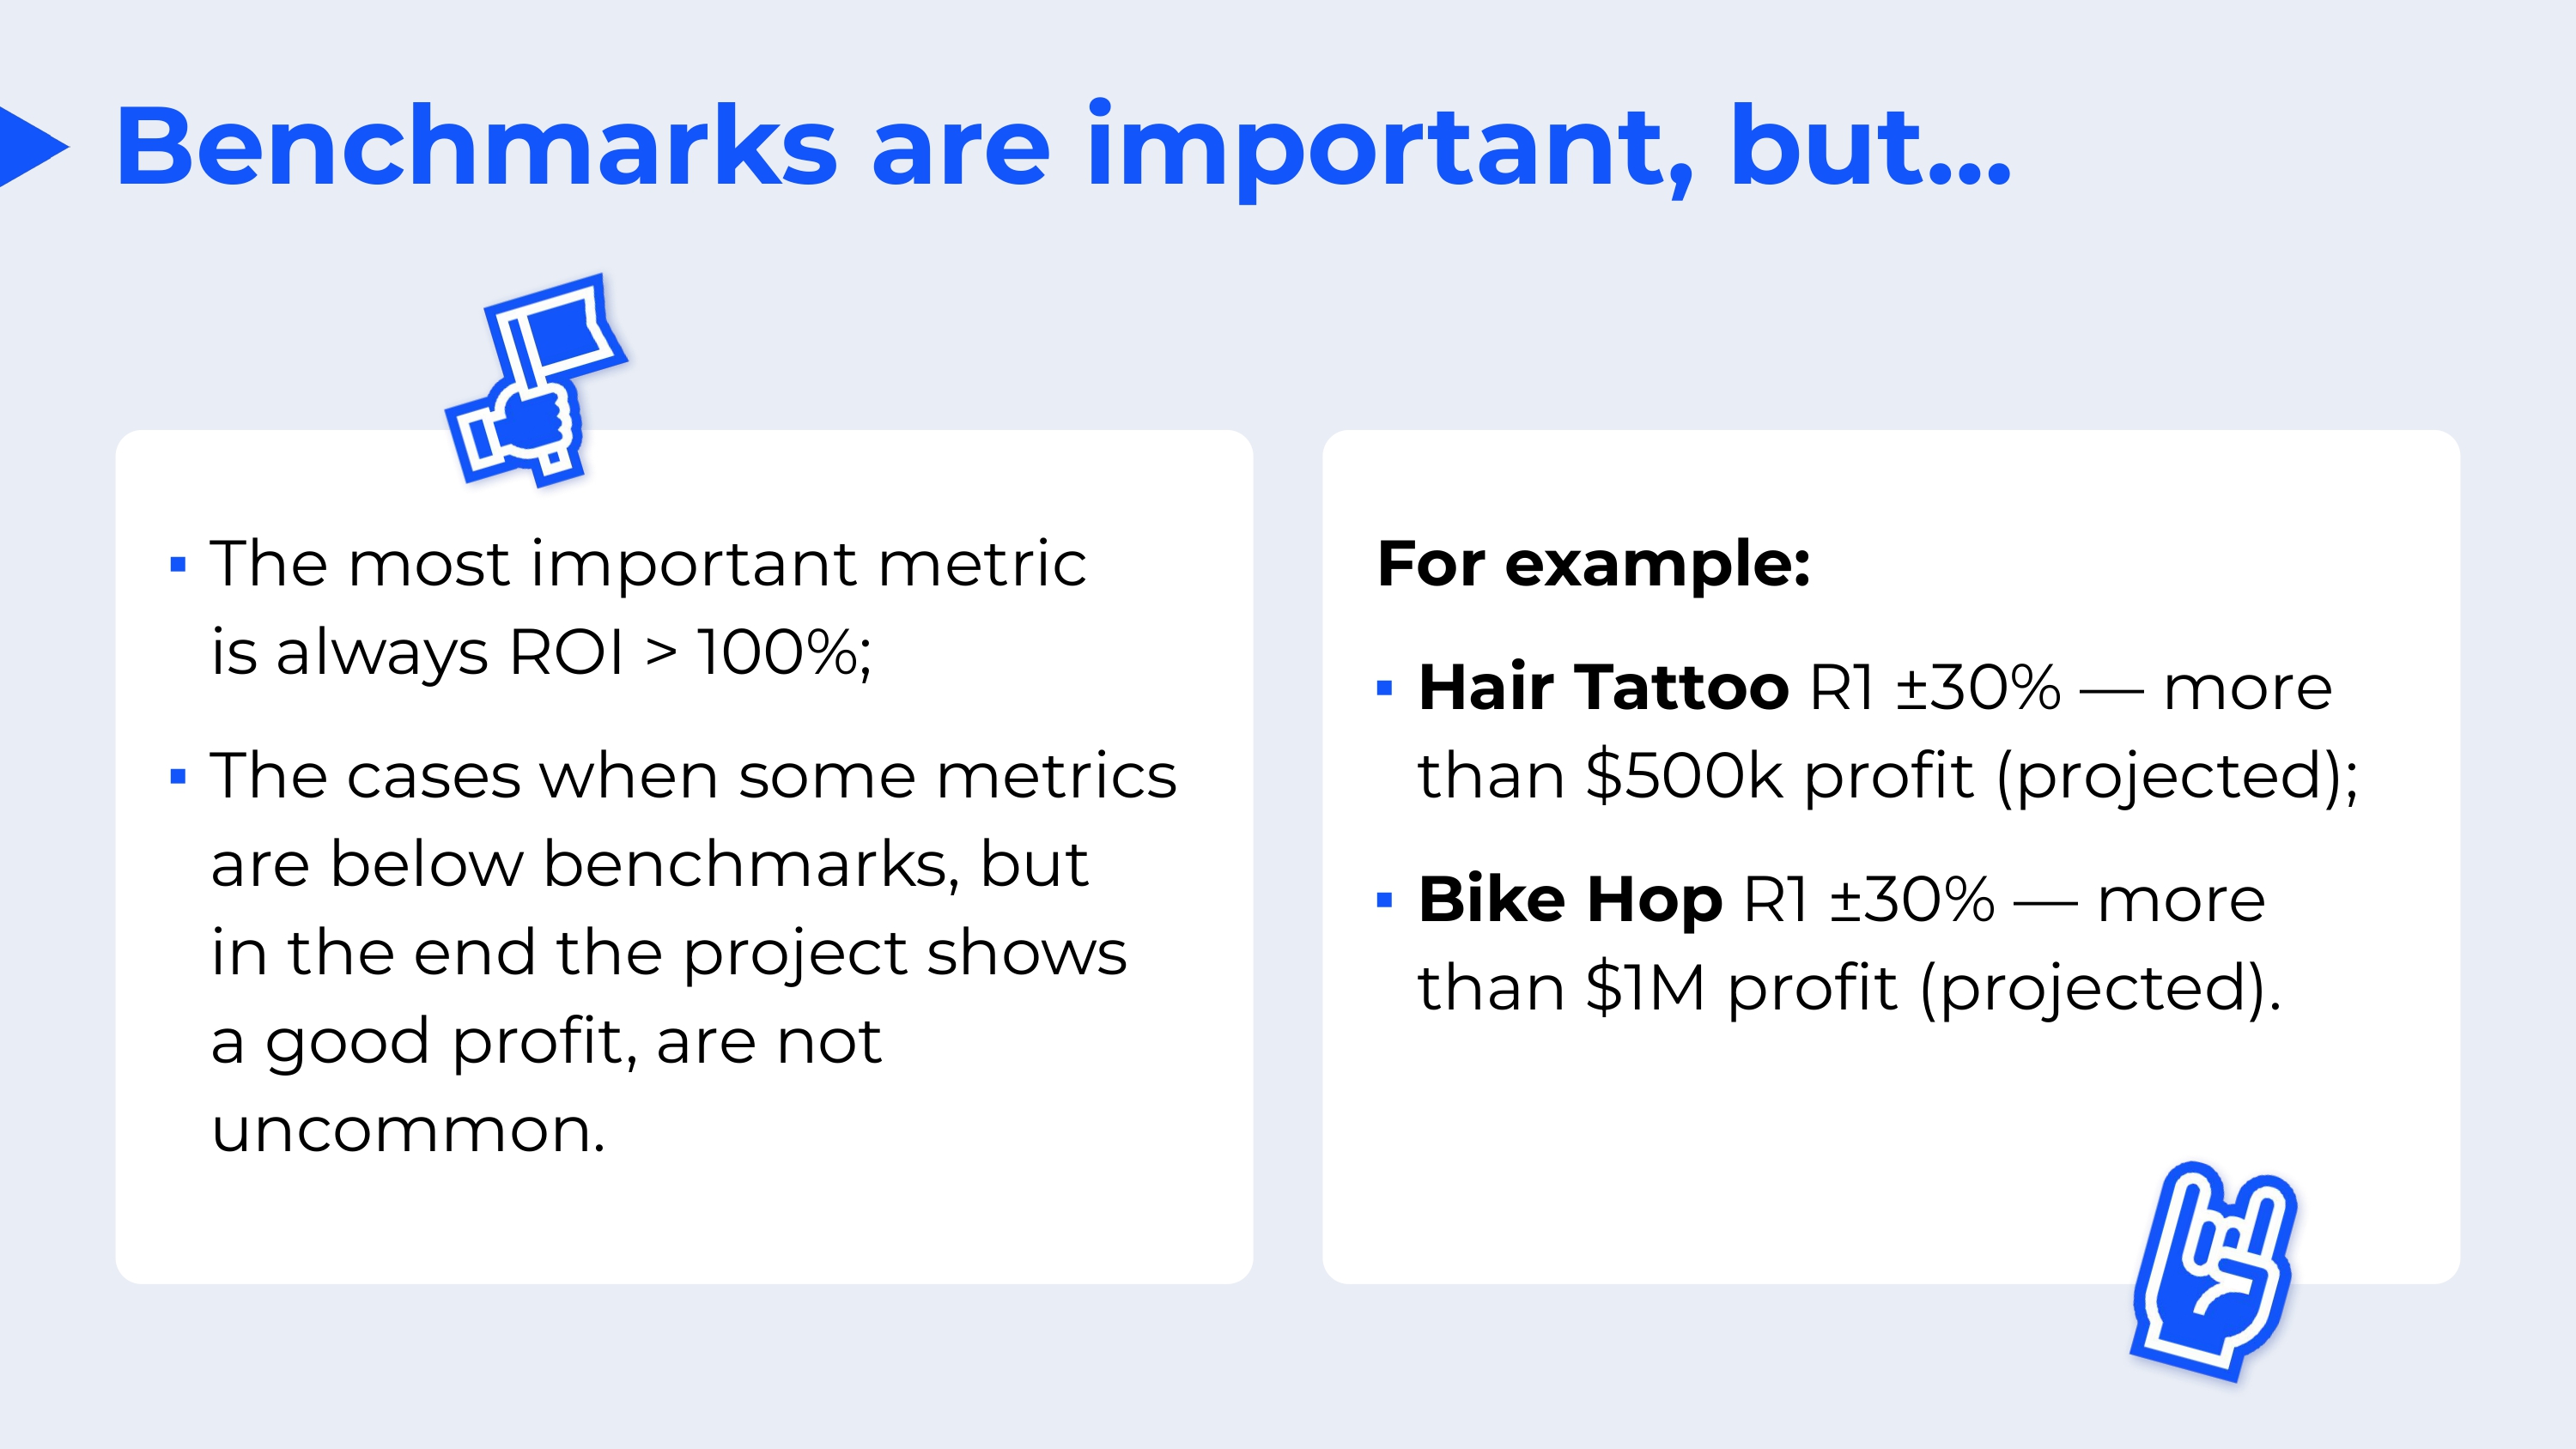
For example, you may have a fairly low retention, but the organic percentage will be very high. And it’s good for the product. Or you may have a high CPI, but your LTV is even higher. And this can also lead to a good ROI. So it is not uncommon for some metrics to be lower than the reference values, but in the end the product shows a good profit. For example, we have Hair Tattoo and Bike Hope projects, which have R1 of about 30%, but they can get an excellent profit by the end of their life cycle.
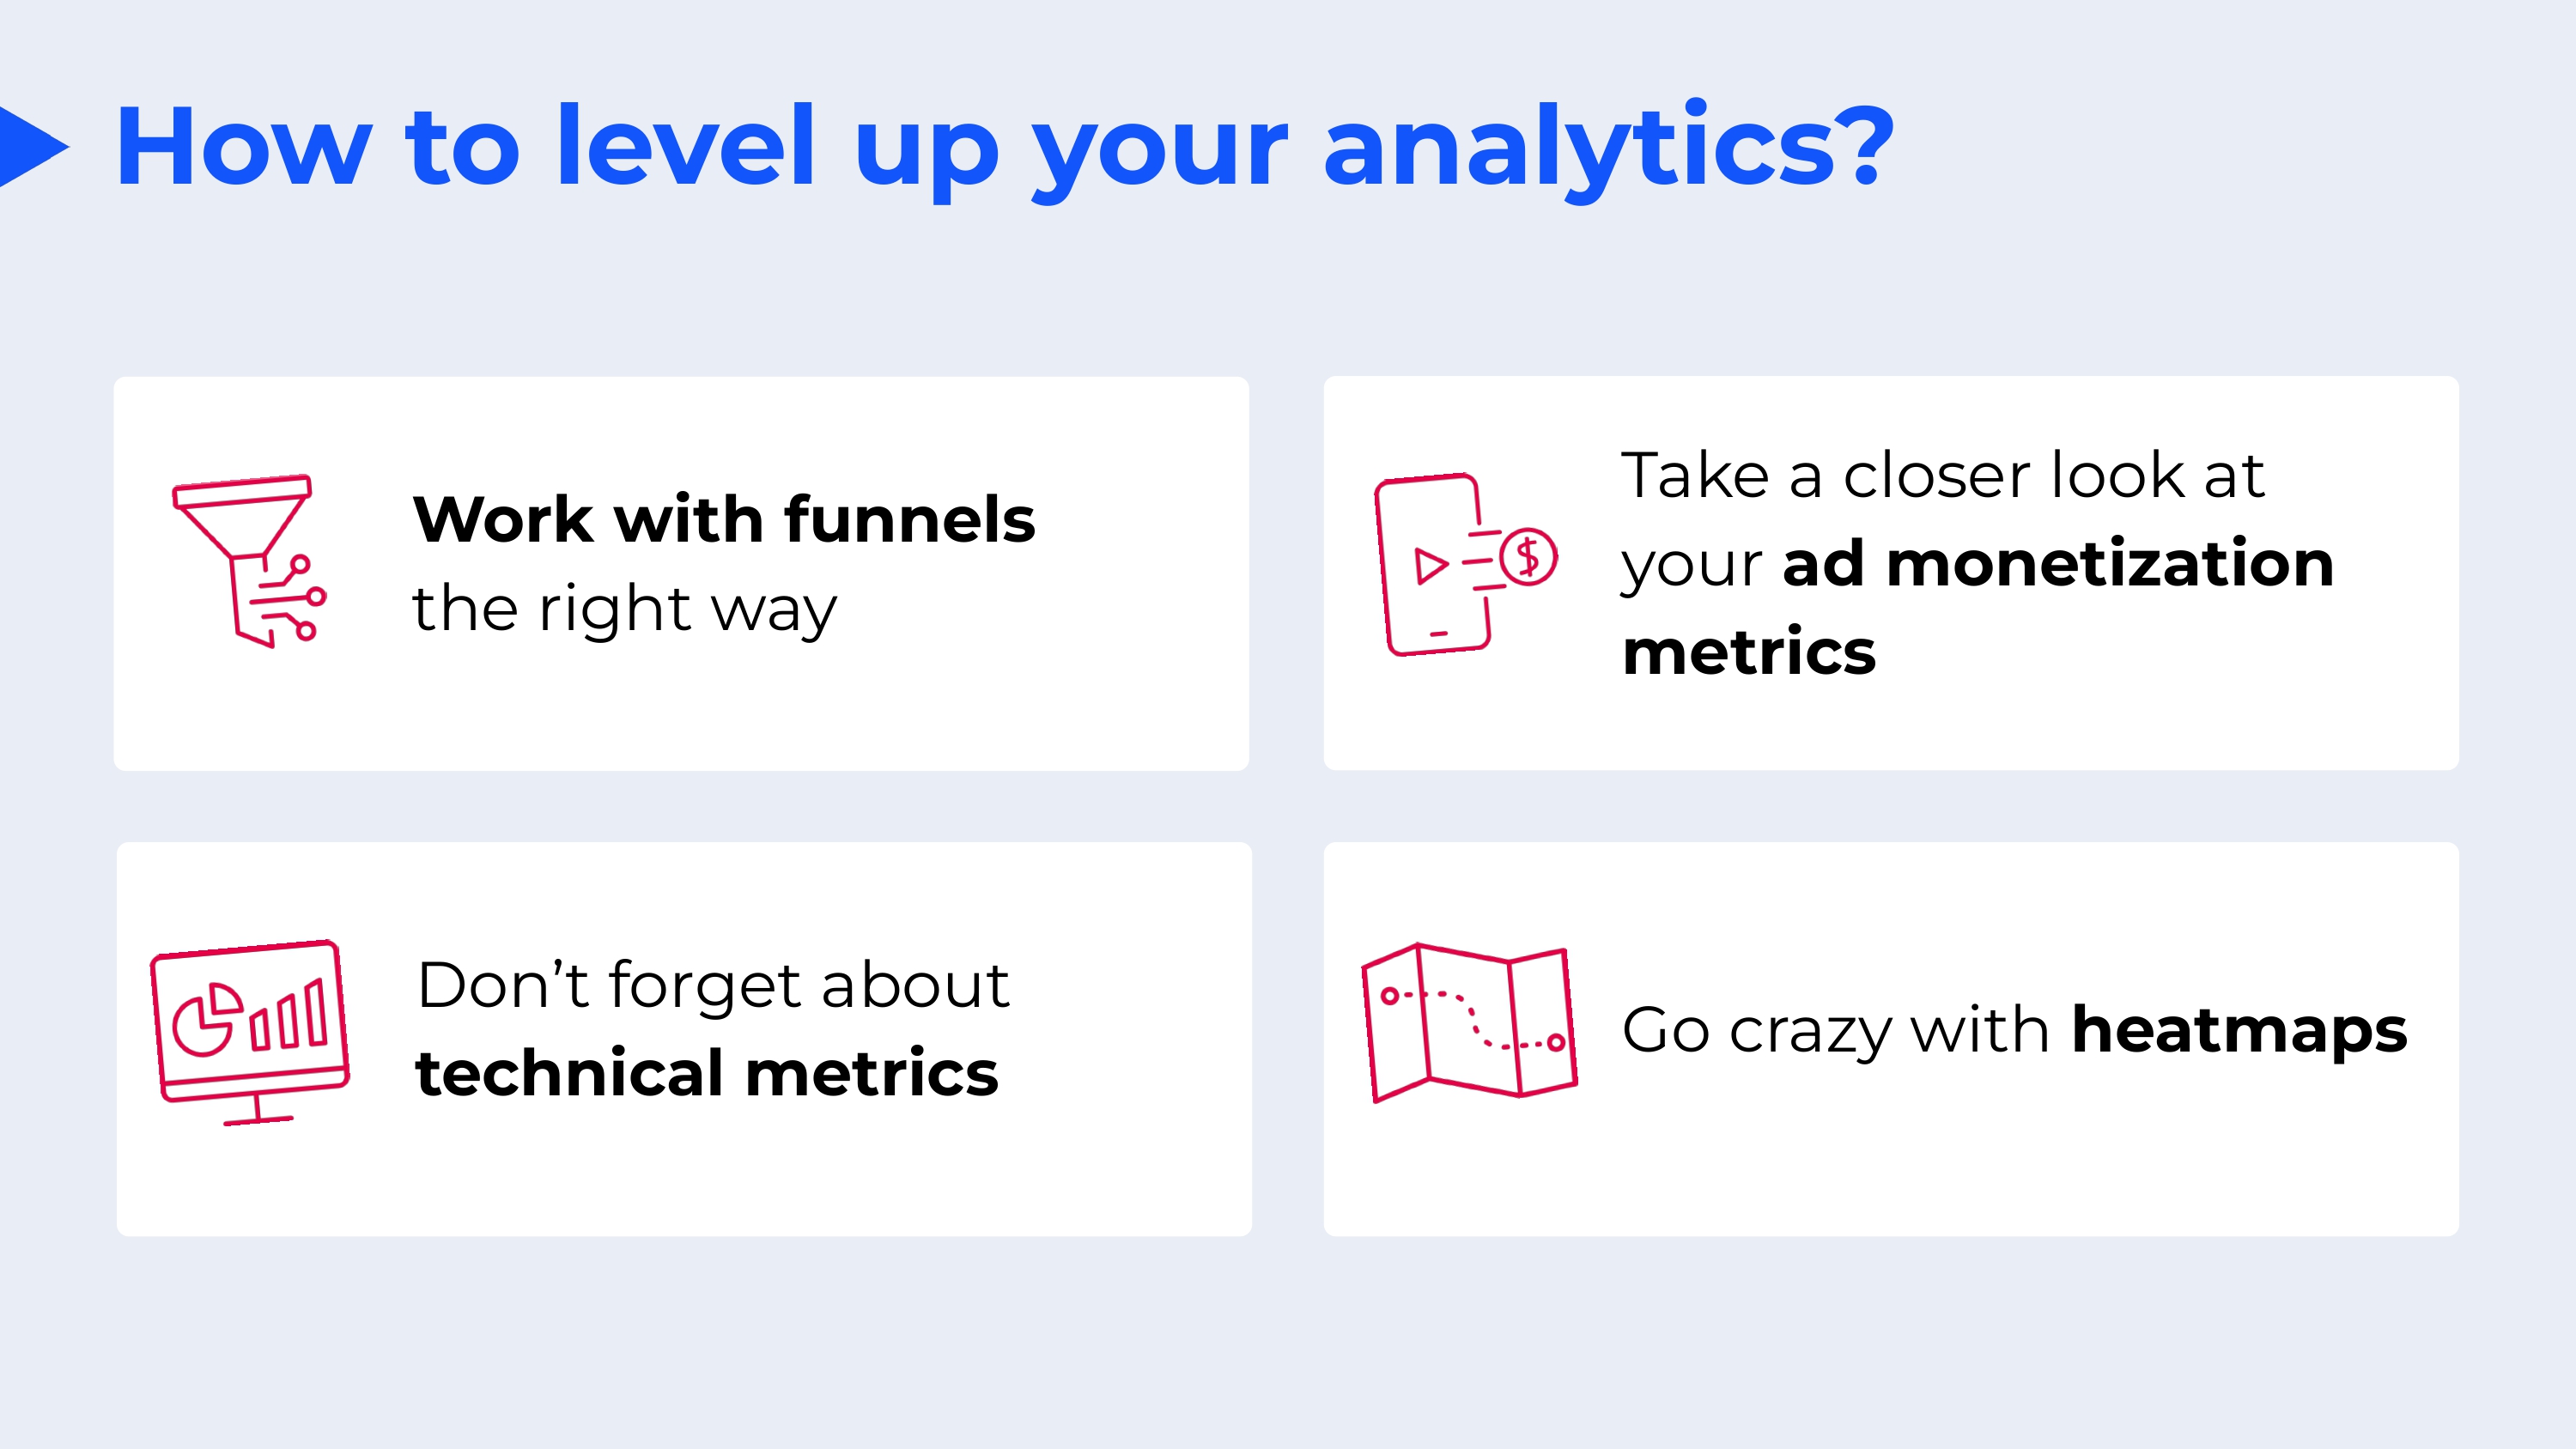
Now let’s move on to more complicated things. I will divide them into four topics: funnels, advertising monetization metrics, technical metrics, and the most interesting part is how to work with heat maps.
Let’s start with the funnels. They are a fairly common tool in analytics and are used to track the outflow of users at different stages.
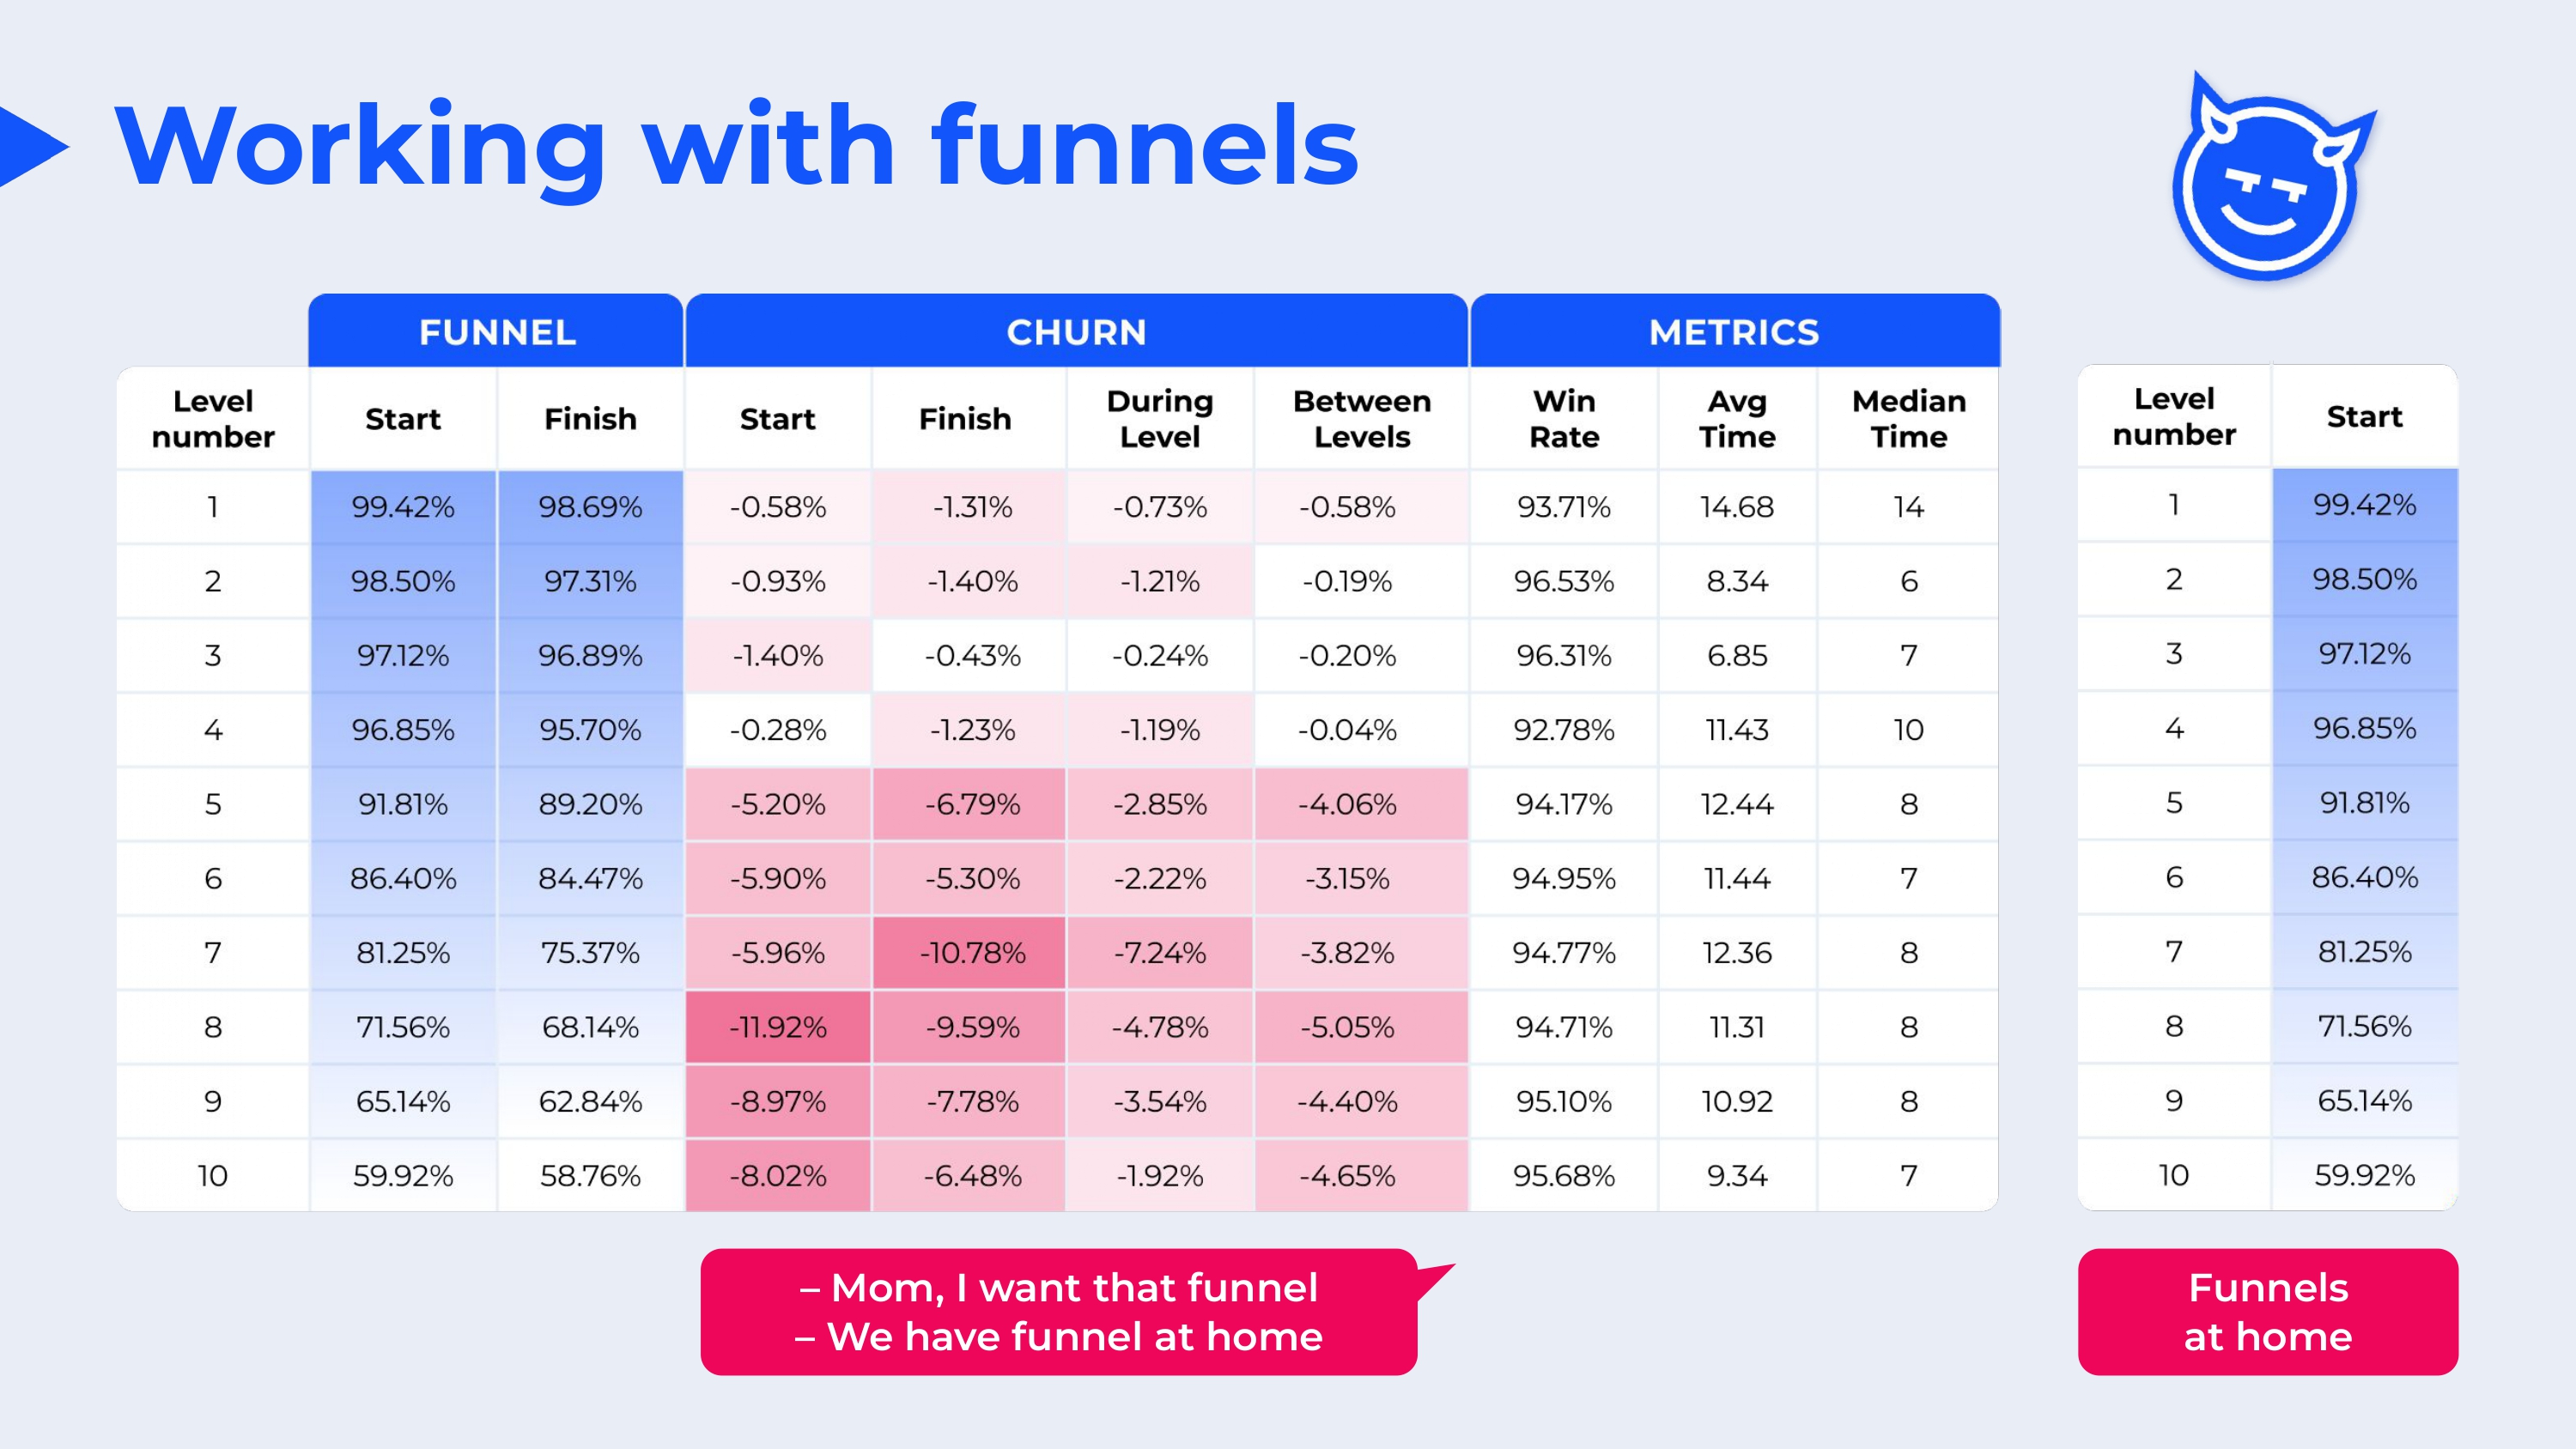
On the right you can see an example of a simple funnel of passing levels in one of our games. But in fact, there is little information in it to draw conclusions.
Therefore, we will add more parameters, as in the left table. First, we divide our funnel into the start of the level and its completion. This allows you to understand at what stage people actually leave the game — during the level itself or between them, which happens for completely different reasons
We also add the percentage of wins and the average time spent on the level to know exactly why the user left: because of the difficulty or because it is too long.
Let’s take a closer look at why it is so important to look at the length of the stages when working with an outflow coefficient. Here is an example for an urban planning game or an idler.

At first glance, it seems that the fourth stage is the worst with a sharp jump in outflow of 20%, but in fact everything is somewhat more complicated. Add to this funnel the time that has elapsed since the installation.

Yes, at the fourth stage the outflow is 20%, while at the other stages it is only 10%. But the fourth stage takes longer to complete, so it makes sense that more people will leave the game for a longer period of time.
To clarify the situation, let’s plot all the points on the graph, where the Y—axis is the percentage of players since installation, and the X—axis is the time elapsed since installation. Now it can be seen that in fact the fourth stage is on the same line with all the other stages, with the exception of the third. Because 10% churn is a lot for just 30 seconds of gameplay. So it’s really worth looking for problems there, and not at the fourth stage.
Now let’s talk about advertising networks.
We have a lot of networks in games, but in some cases, advertising from some networks can cause a negative reaction from users. For example, they may have problems with the SDK, or problems closing the advertising window, or they may just have aggressive advertising. To keep track of this problem, we look at the closing rate of sessions. An example of this metric can be seen in this table.

This is real data from one of our games. To calculate this metric, we divide the number of impressions that led to the closure of the session by the total number of network impressions. As you can see, it is obvious that some of the networks work worse than others.
Then we completely disabled AdNetwork at numbers 5 and 6. This led to an increase in retention and LTV by 10%. It is usually a bad idea to completely disable advertising networks, because your eCPM may drop, but in some cases, an increase in retention due to the shutdown of some networks can compensate for the drop in eCPM, and you will be in the black. Even better, disable only specific advertising materials that cause problems, but you need to have a lot of data for this. In our case study, it was a relatively small project, so there was no such data and we completely turned off two advertising networks, but we still got a good increase in metrics.
When analyzing ads, it is also important to look at the distribution of impressions among users.
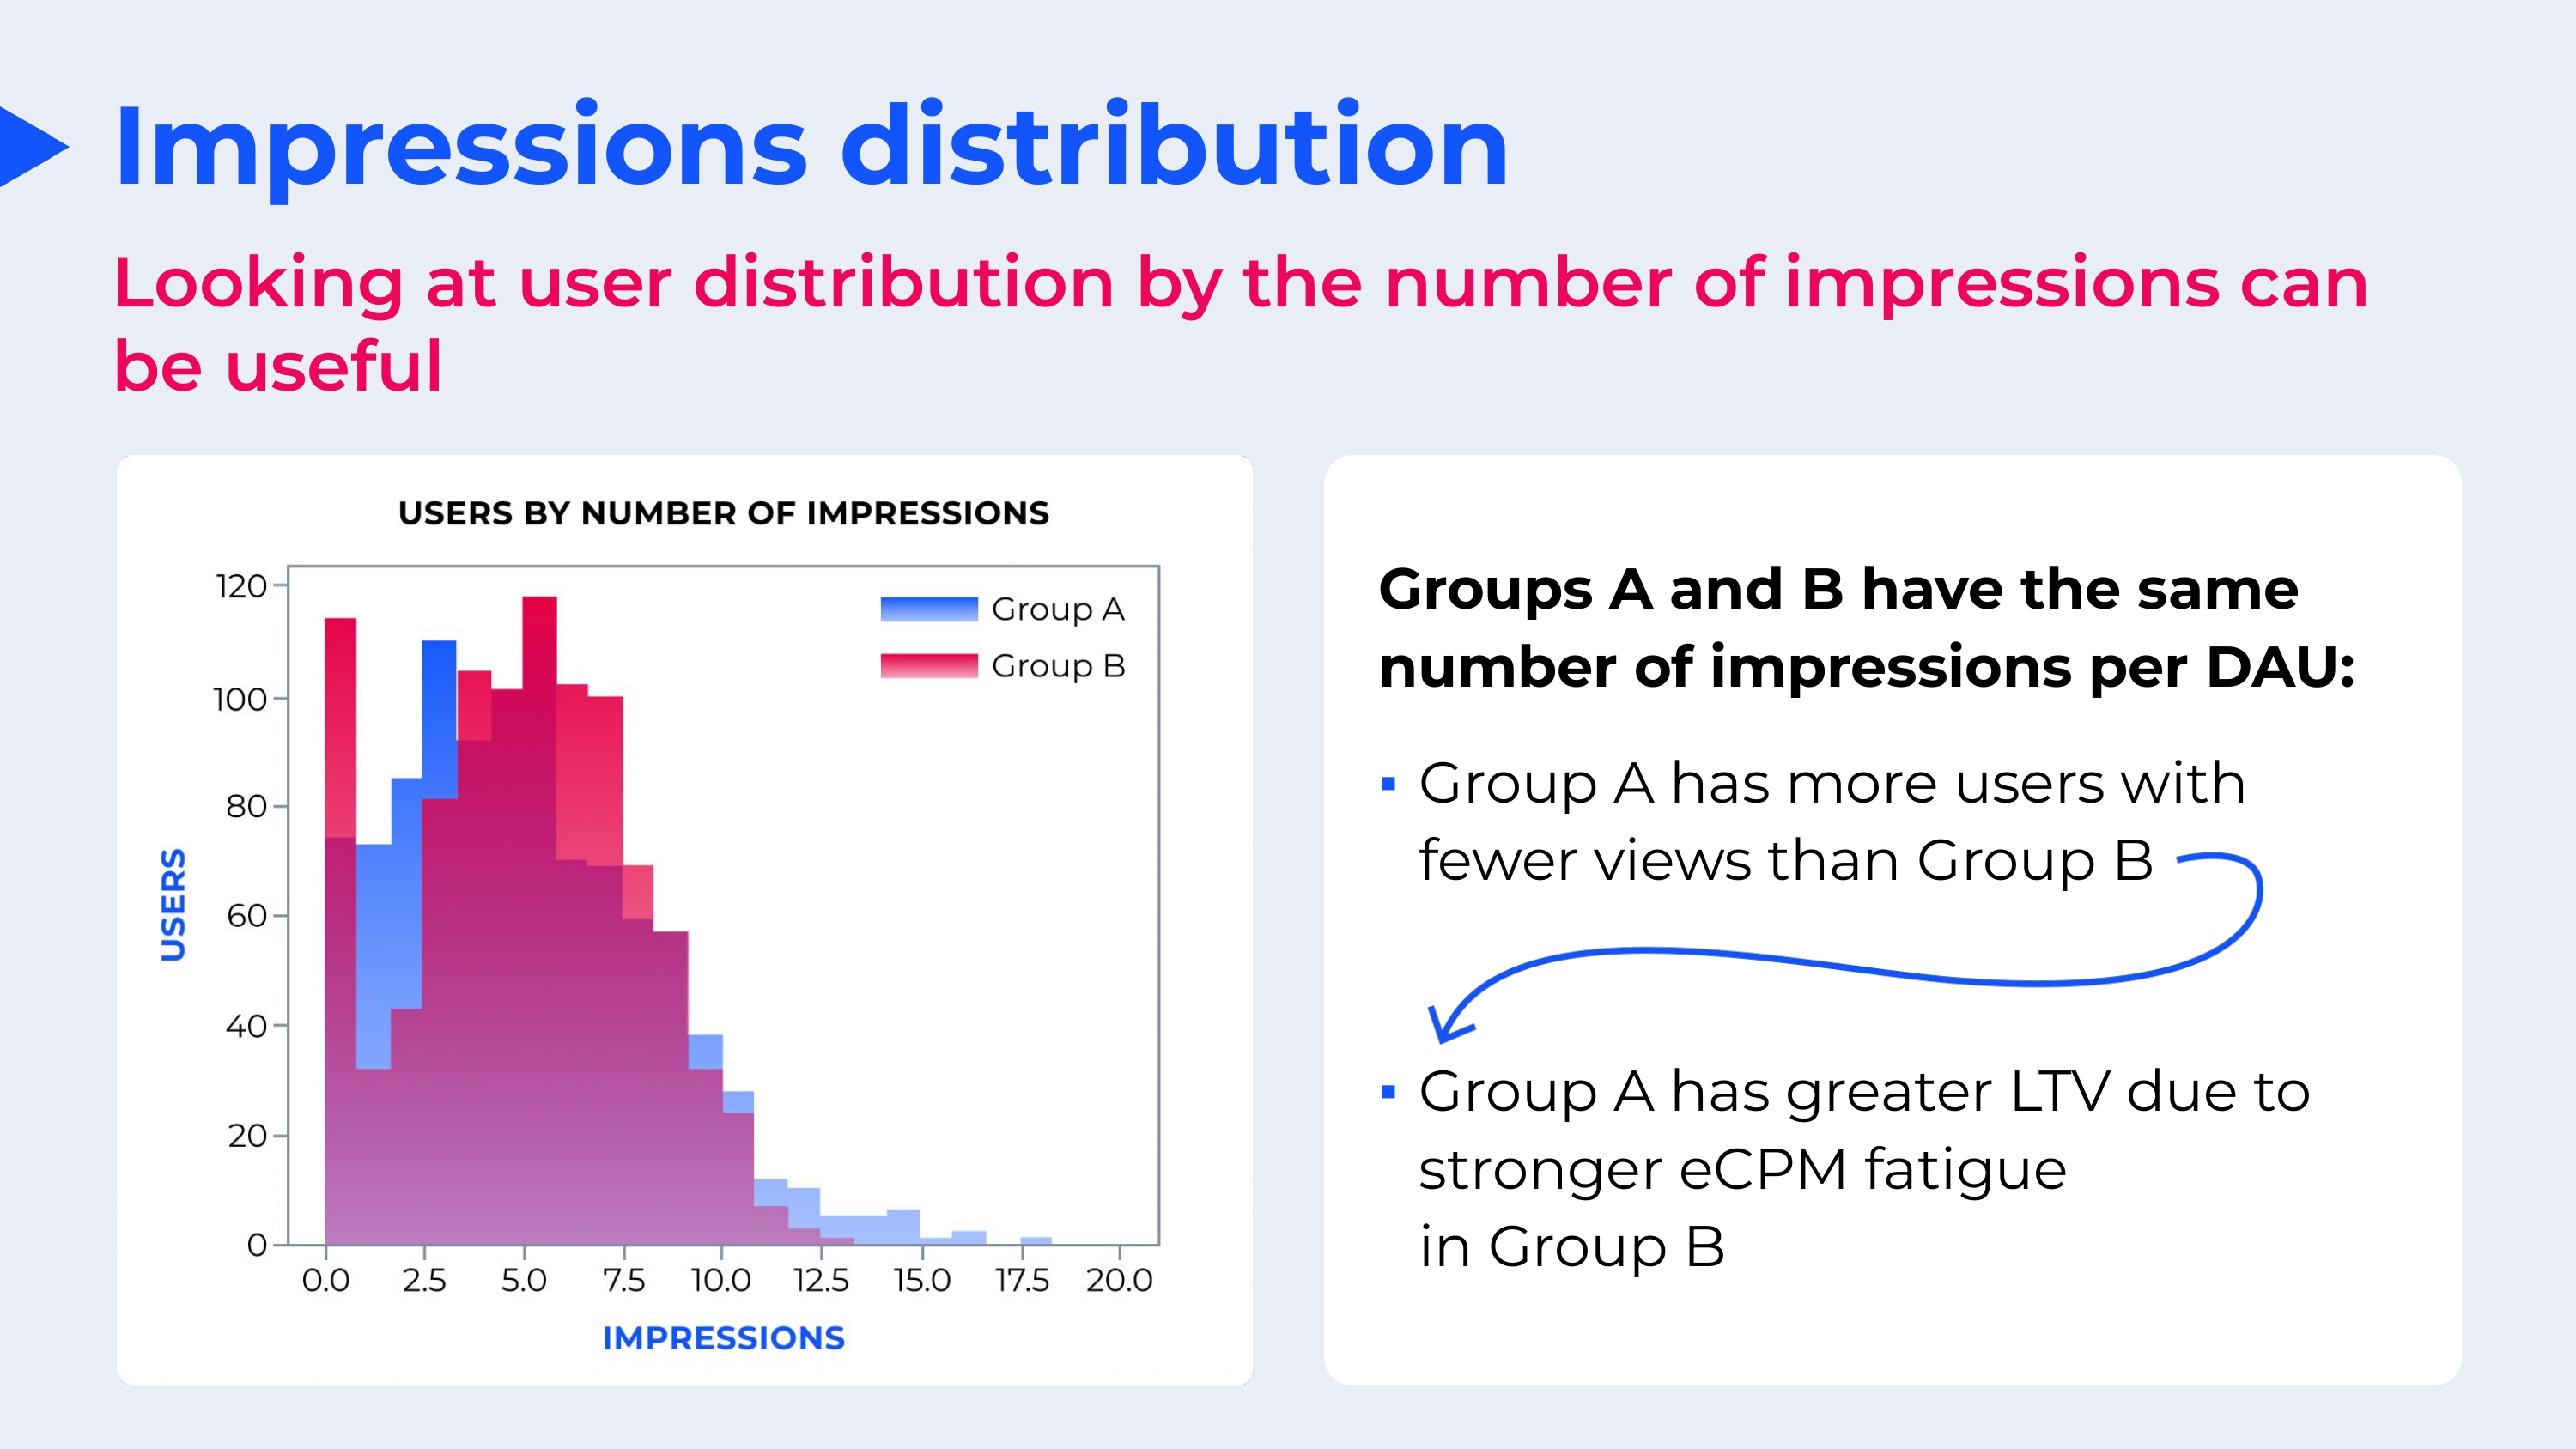
There are cases when you have on average the same number of impressions per user, but in the end these groups have different LTV. This is due to eCPM decay on each subsequent view for each user. For example, if you look at group B on the chart, a lot of users did not watch the ad at all. But also a lot of users have watched a lot of ads. In this case, the LTV in group B will be lower than in group A, although the average number of impressions per person is the same here.
Let’s move on to technical metrics.
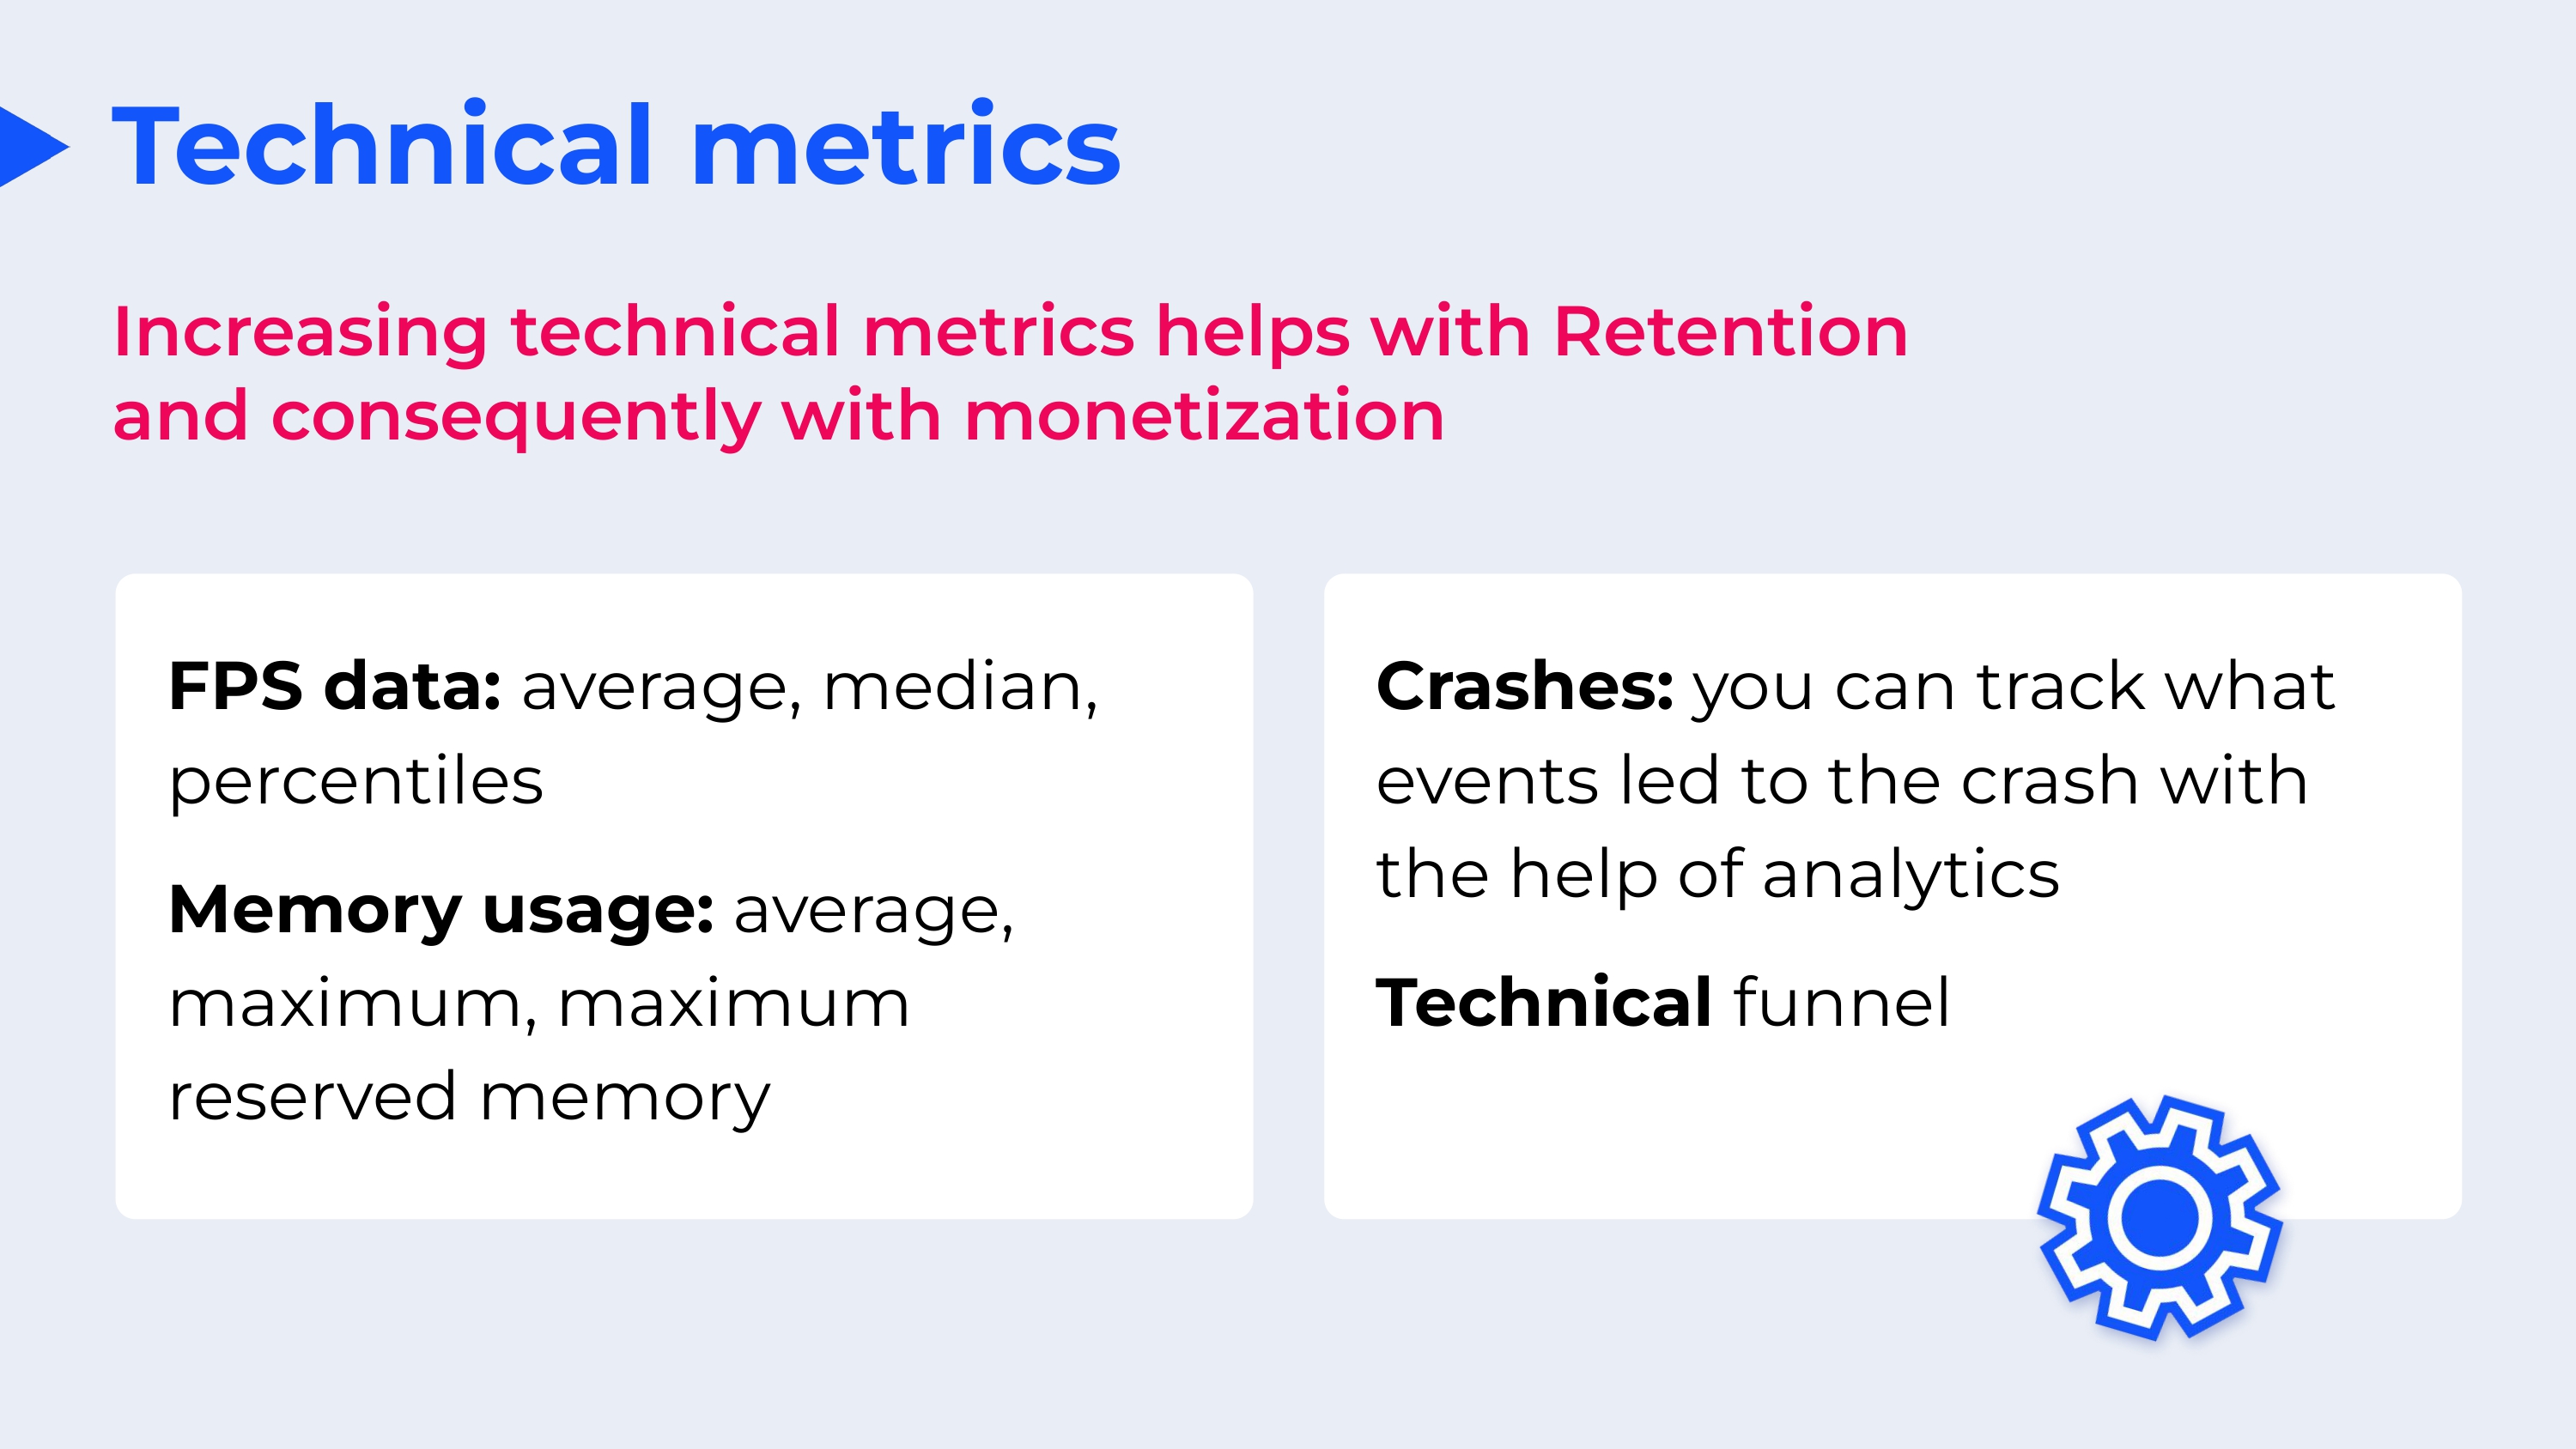
It is quite obvious that the technical condition of your project greatly affects retention and, consequently, monetization. Despite this fact, few people pay attention to them.
What do we mean by technical metrics? Firstly, these are FPS, average and median values to understand how smoothly the game works. We also track the number of FPS jumps, periods of time when FPS drops below certain levels. We monitor memory usage in the same way. It is also useful to send crash data to analytics to know which specific events in the game caused the crash. Of course, it is also worth using special tools to study crashes and errors, such as Crashlytics.
Finally, we use technical funnels to find problems in the loading sequences.
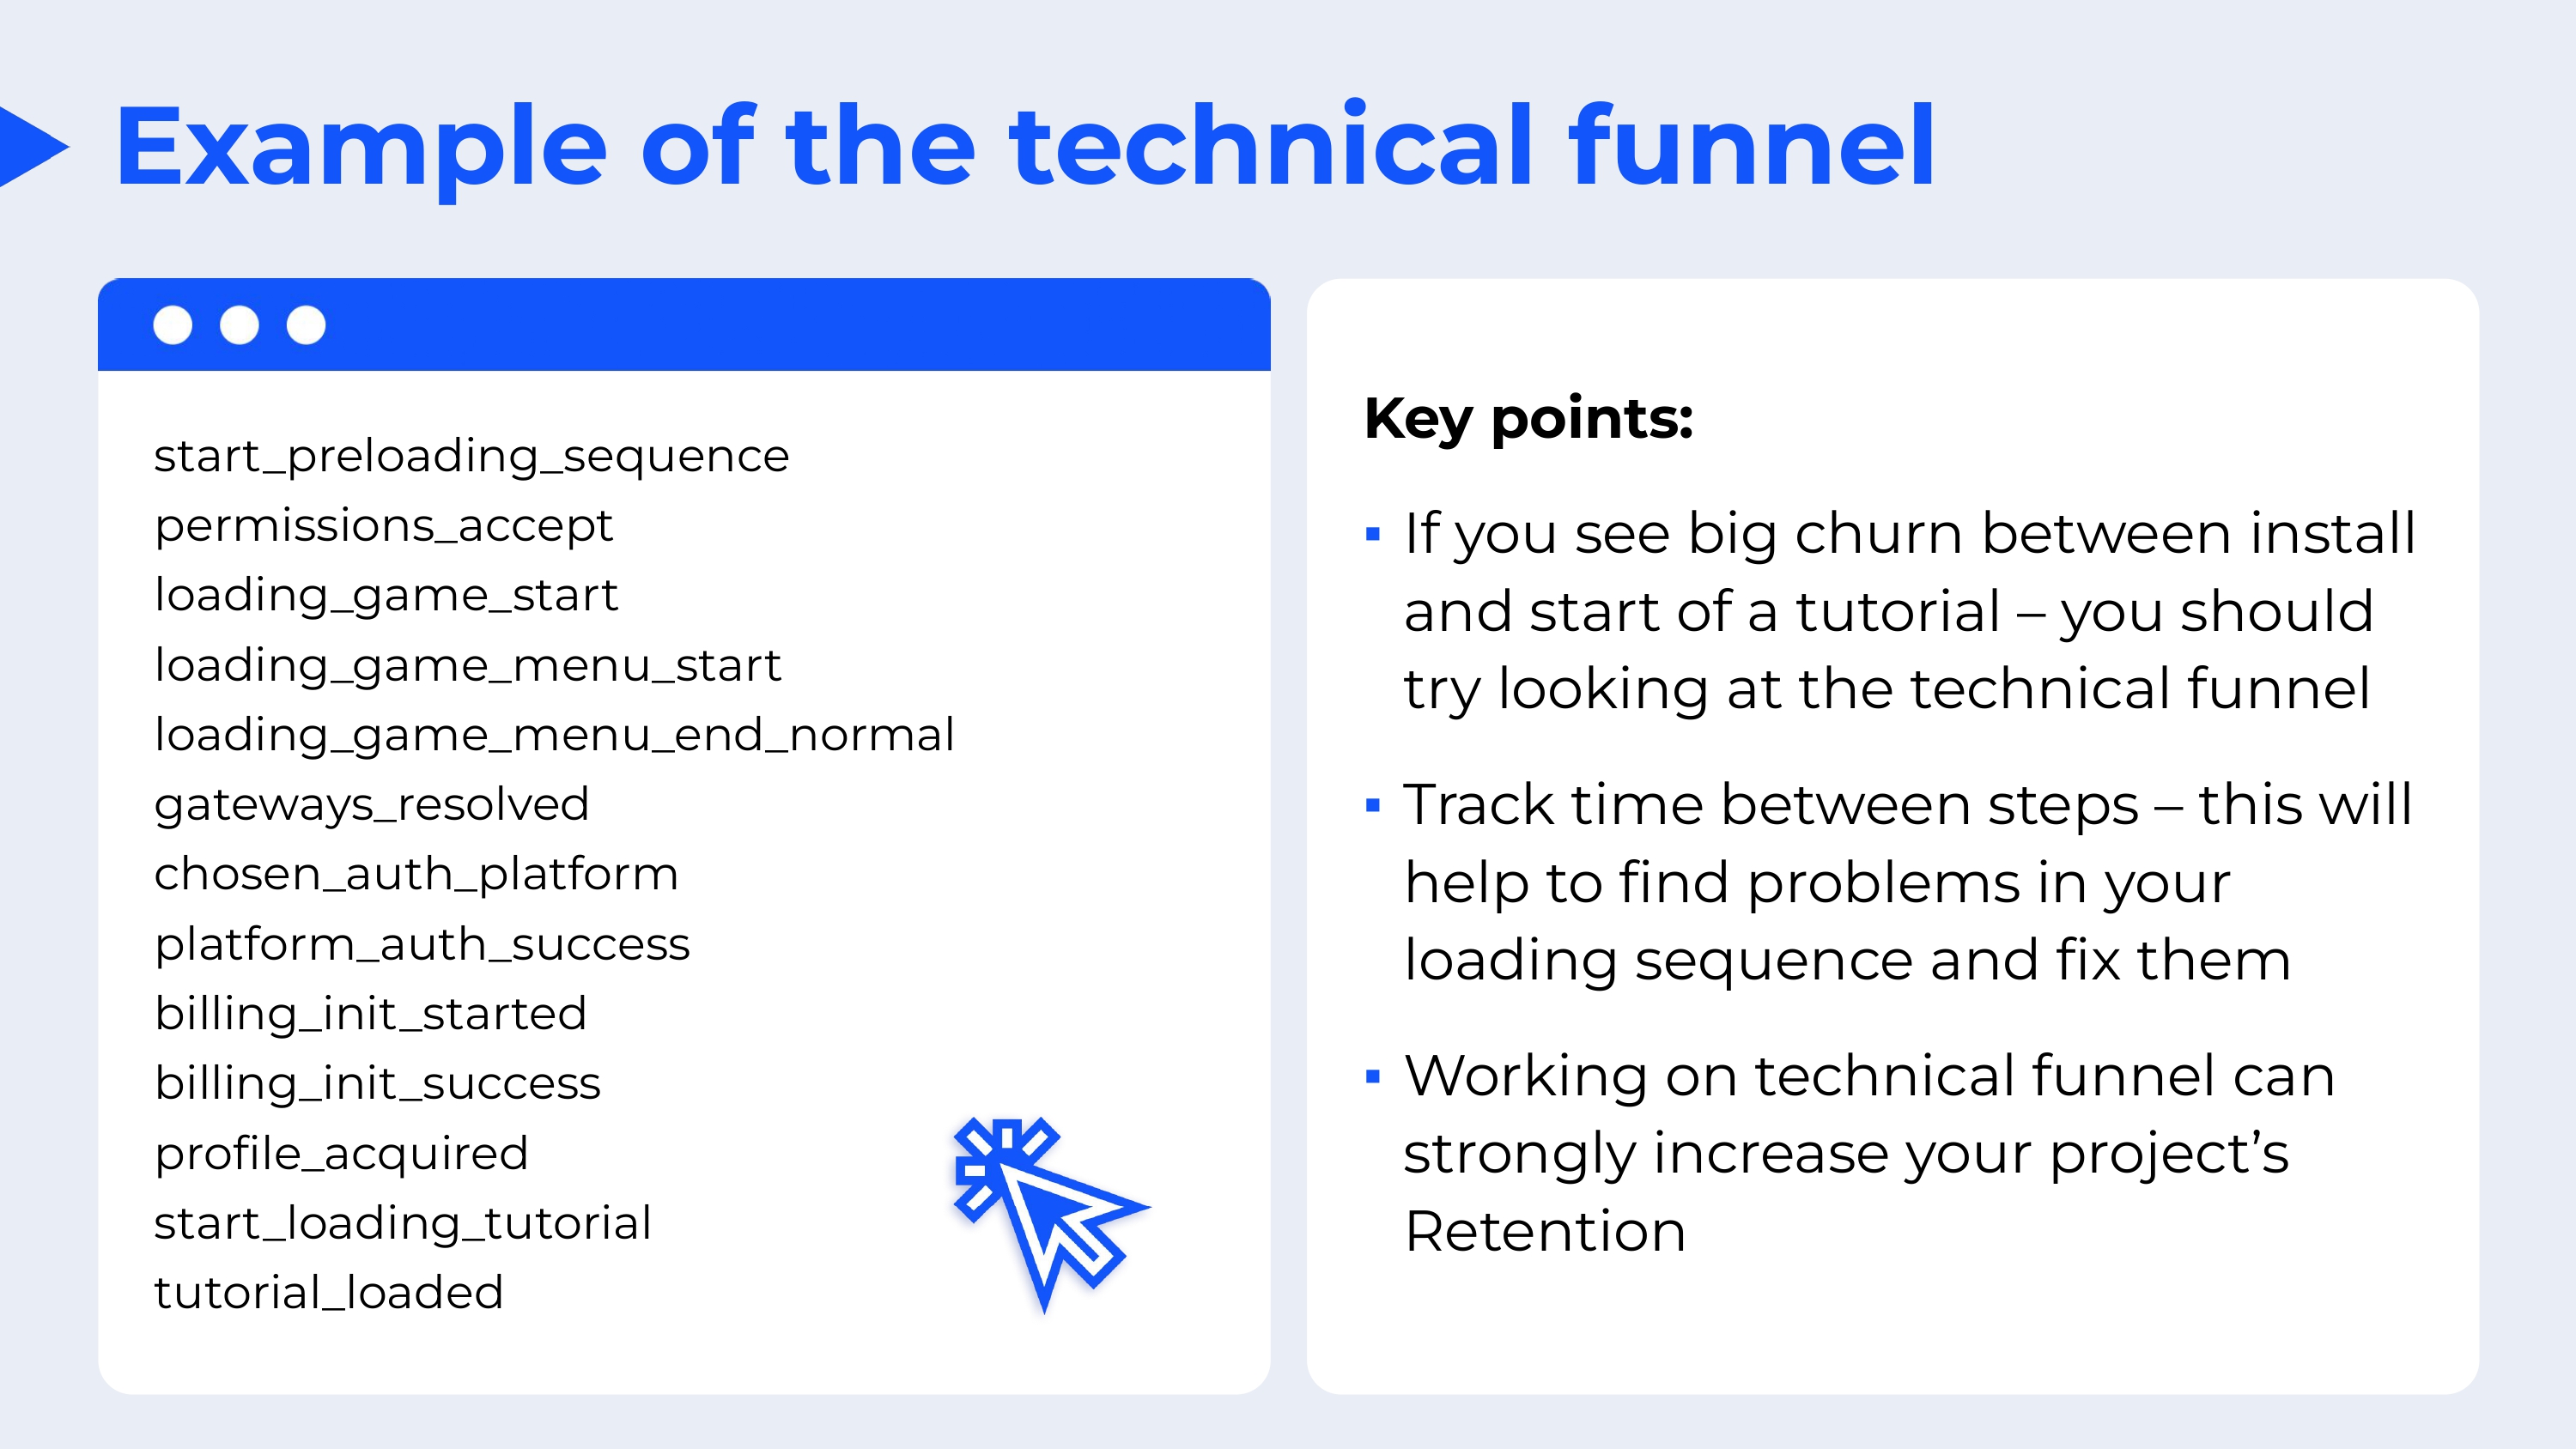
The steps in this funnel represent some important steps, for example, accepting permissions, downloading game resources, downloading the SDK, getting a profile from the server, and similar things. It can really help to find problems.
If you see a large percentage of outflow between installation and the start of the tutorial, you need to look for the problem in the technical funnel. Also keep track of the time between steps in this funnel, because some steps may actually take longer than expected.
Here is an example of how we use technical metrics in a real situation in the multiplayer shooter World War Heroes.
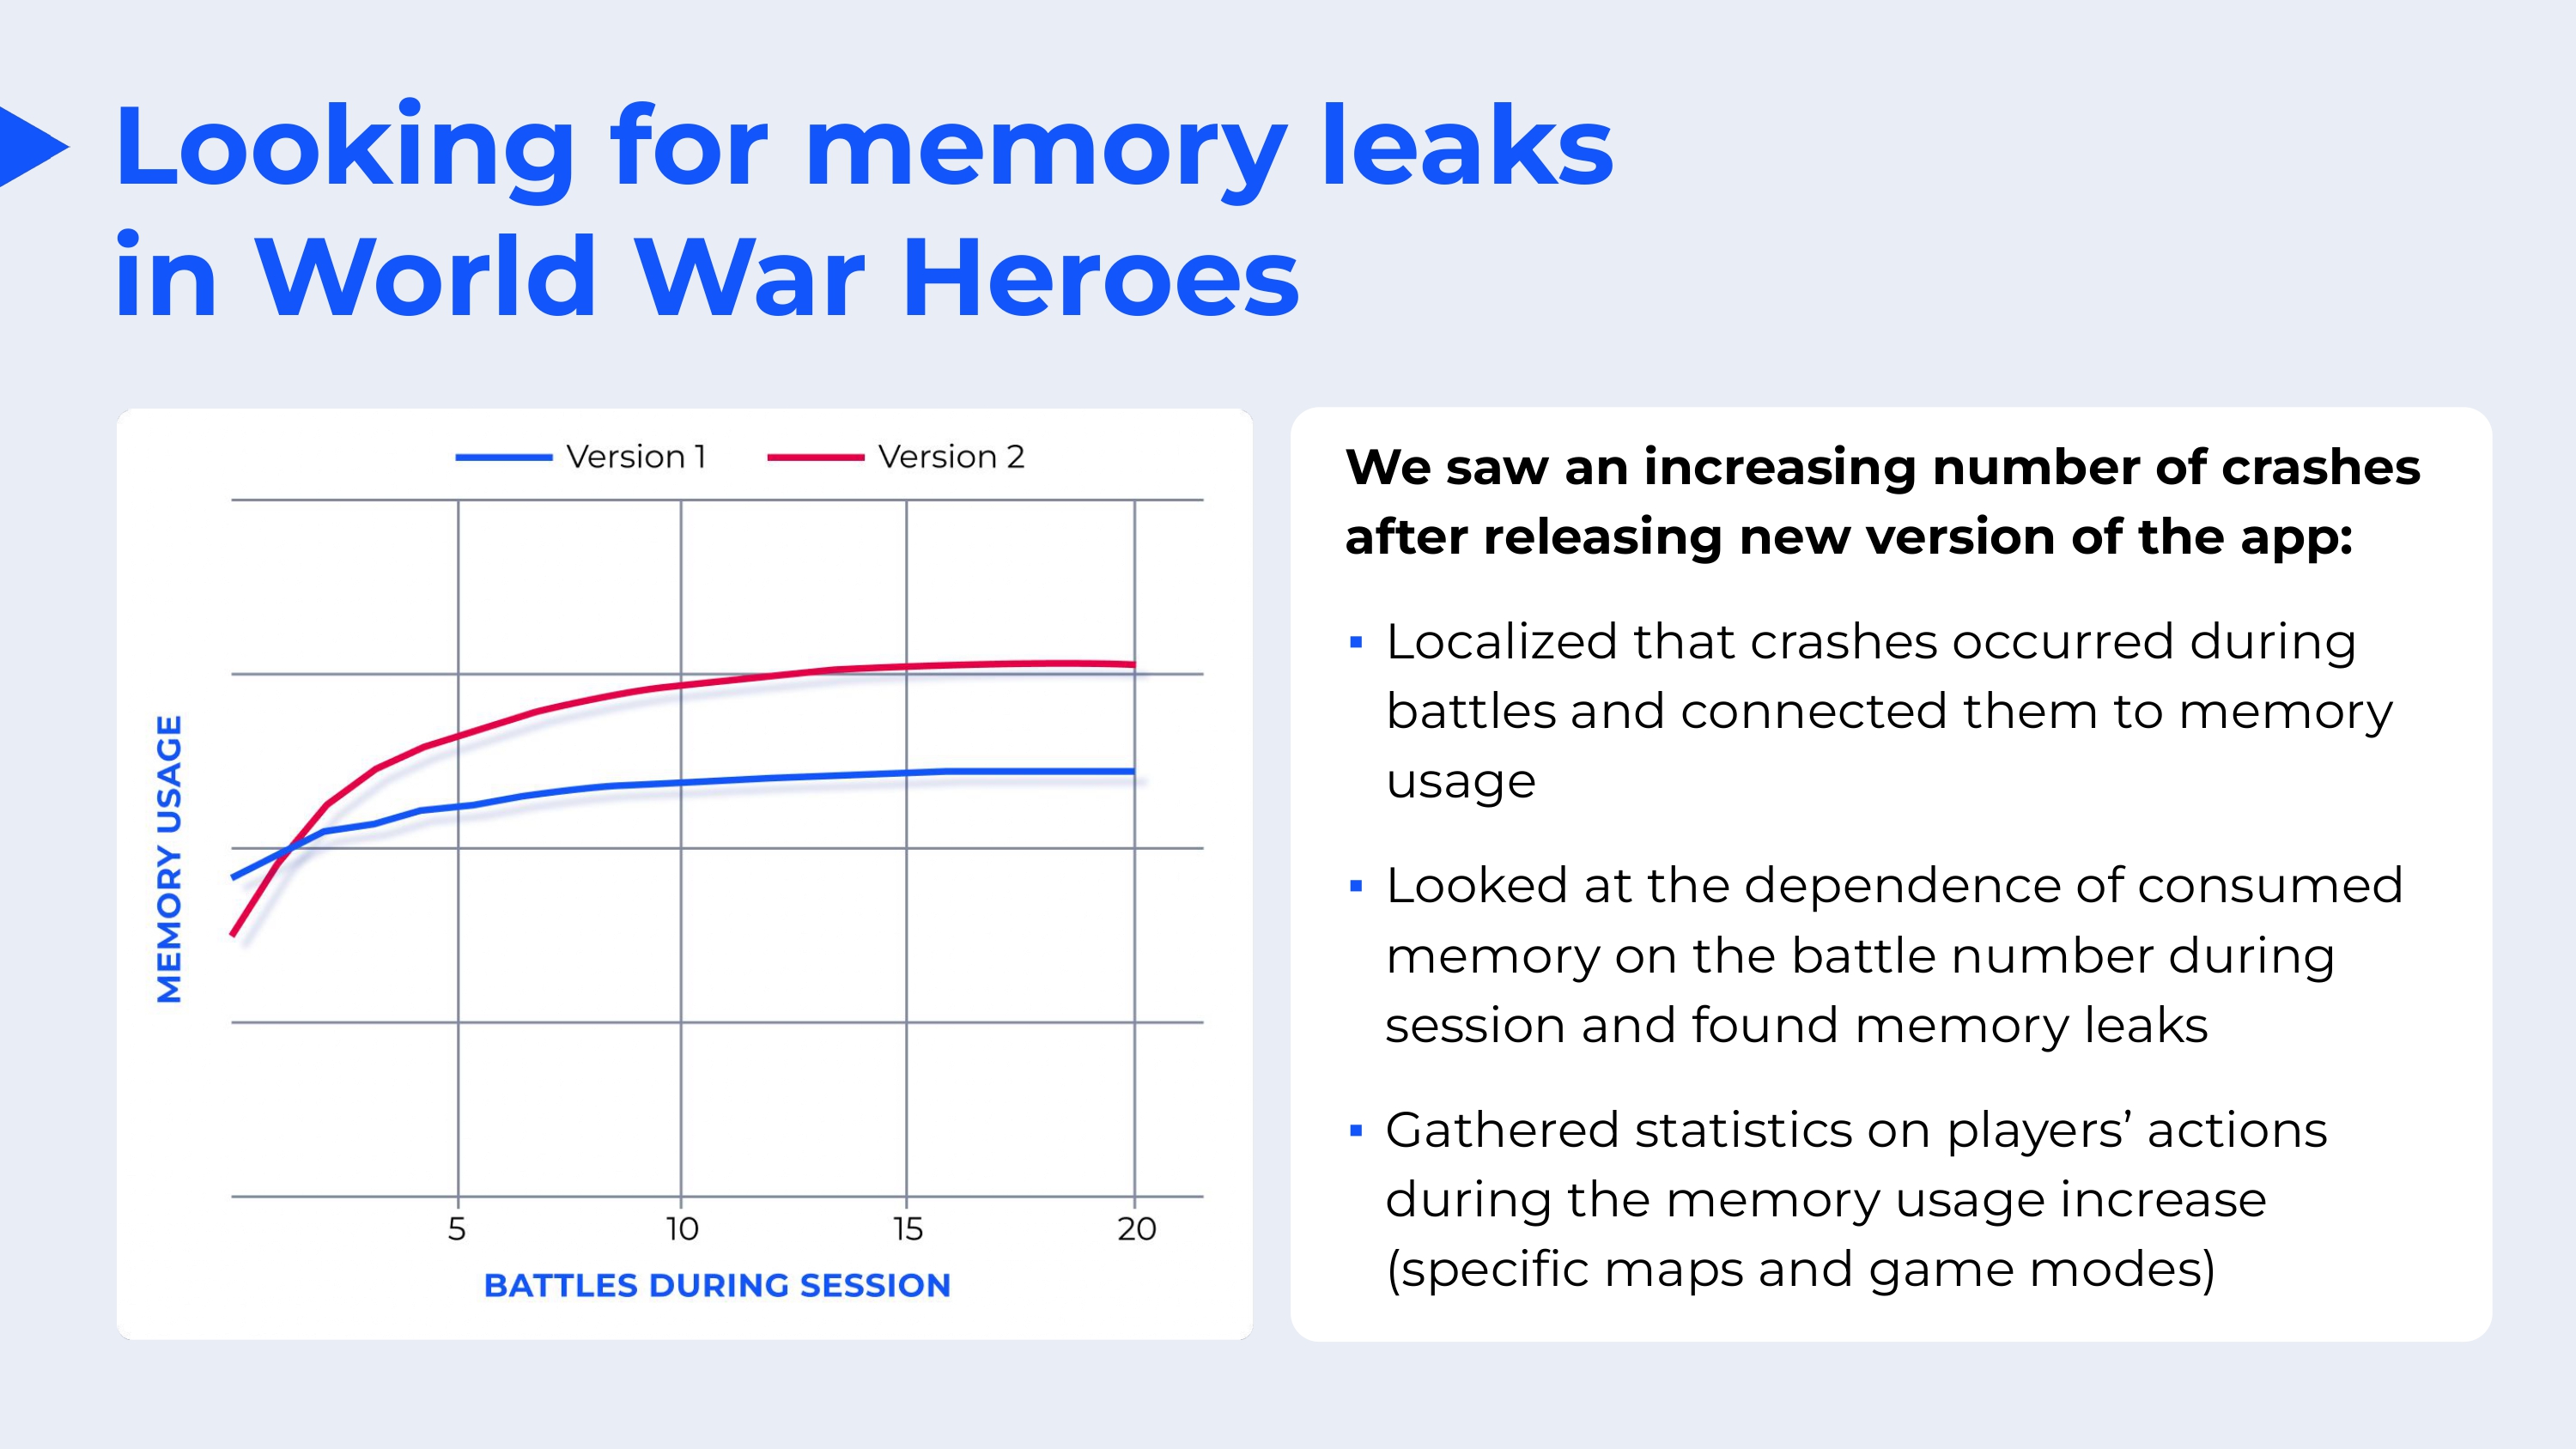
After the release of the new version, we noticed an increase in the number of crashes. The developers have determined that most crashes are related to memory usage. Then analysts found out that crashes occur mainly during battles.
We studied the dependence of the memory used on the battle number and found memory leaks. Then we collected additional analytics on this issue, identified the maps where it happened and the game modes. And all this helped to find and fix the problem.
And finally, heat maps.
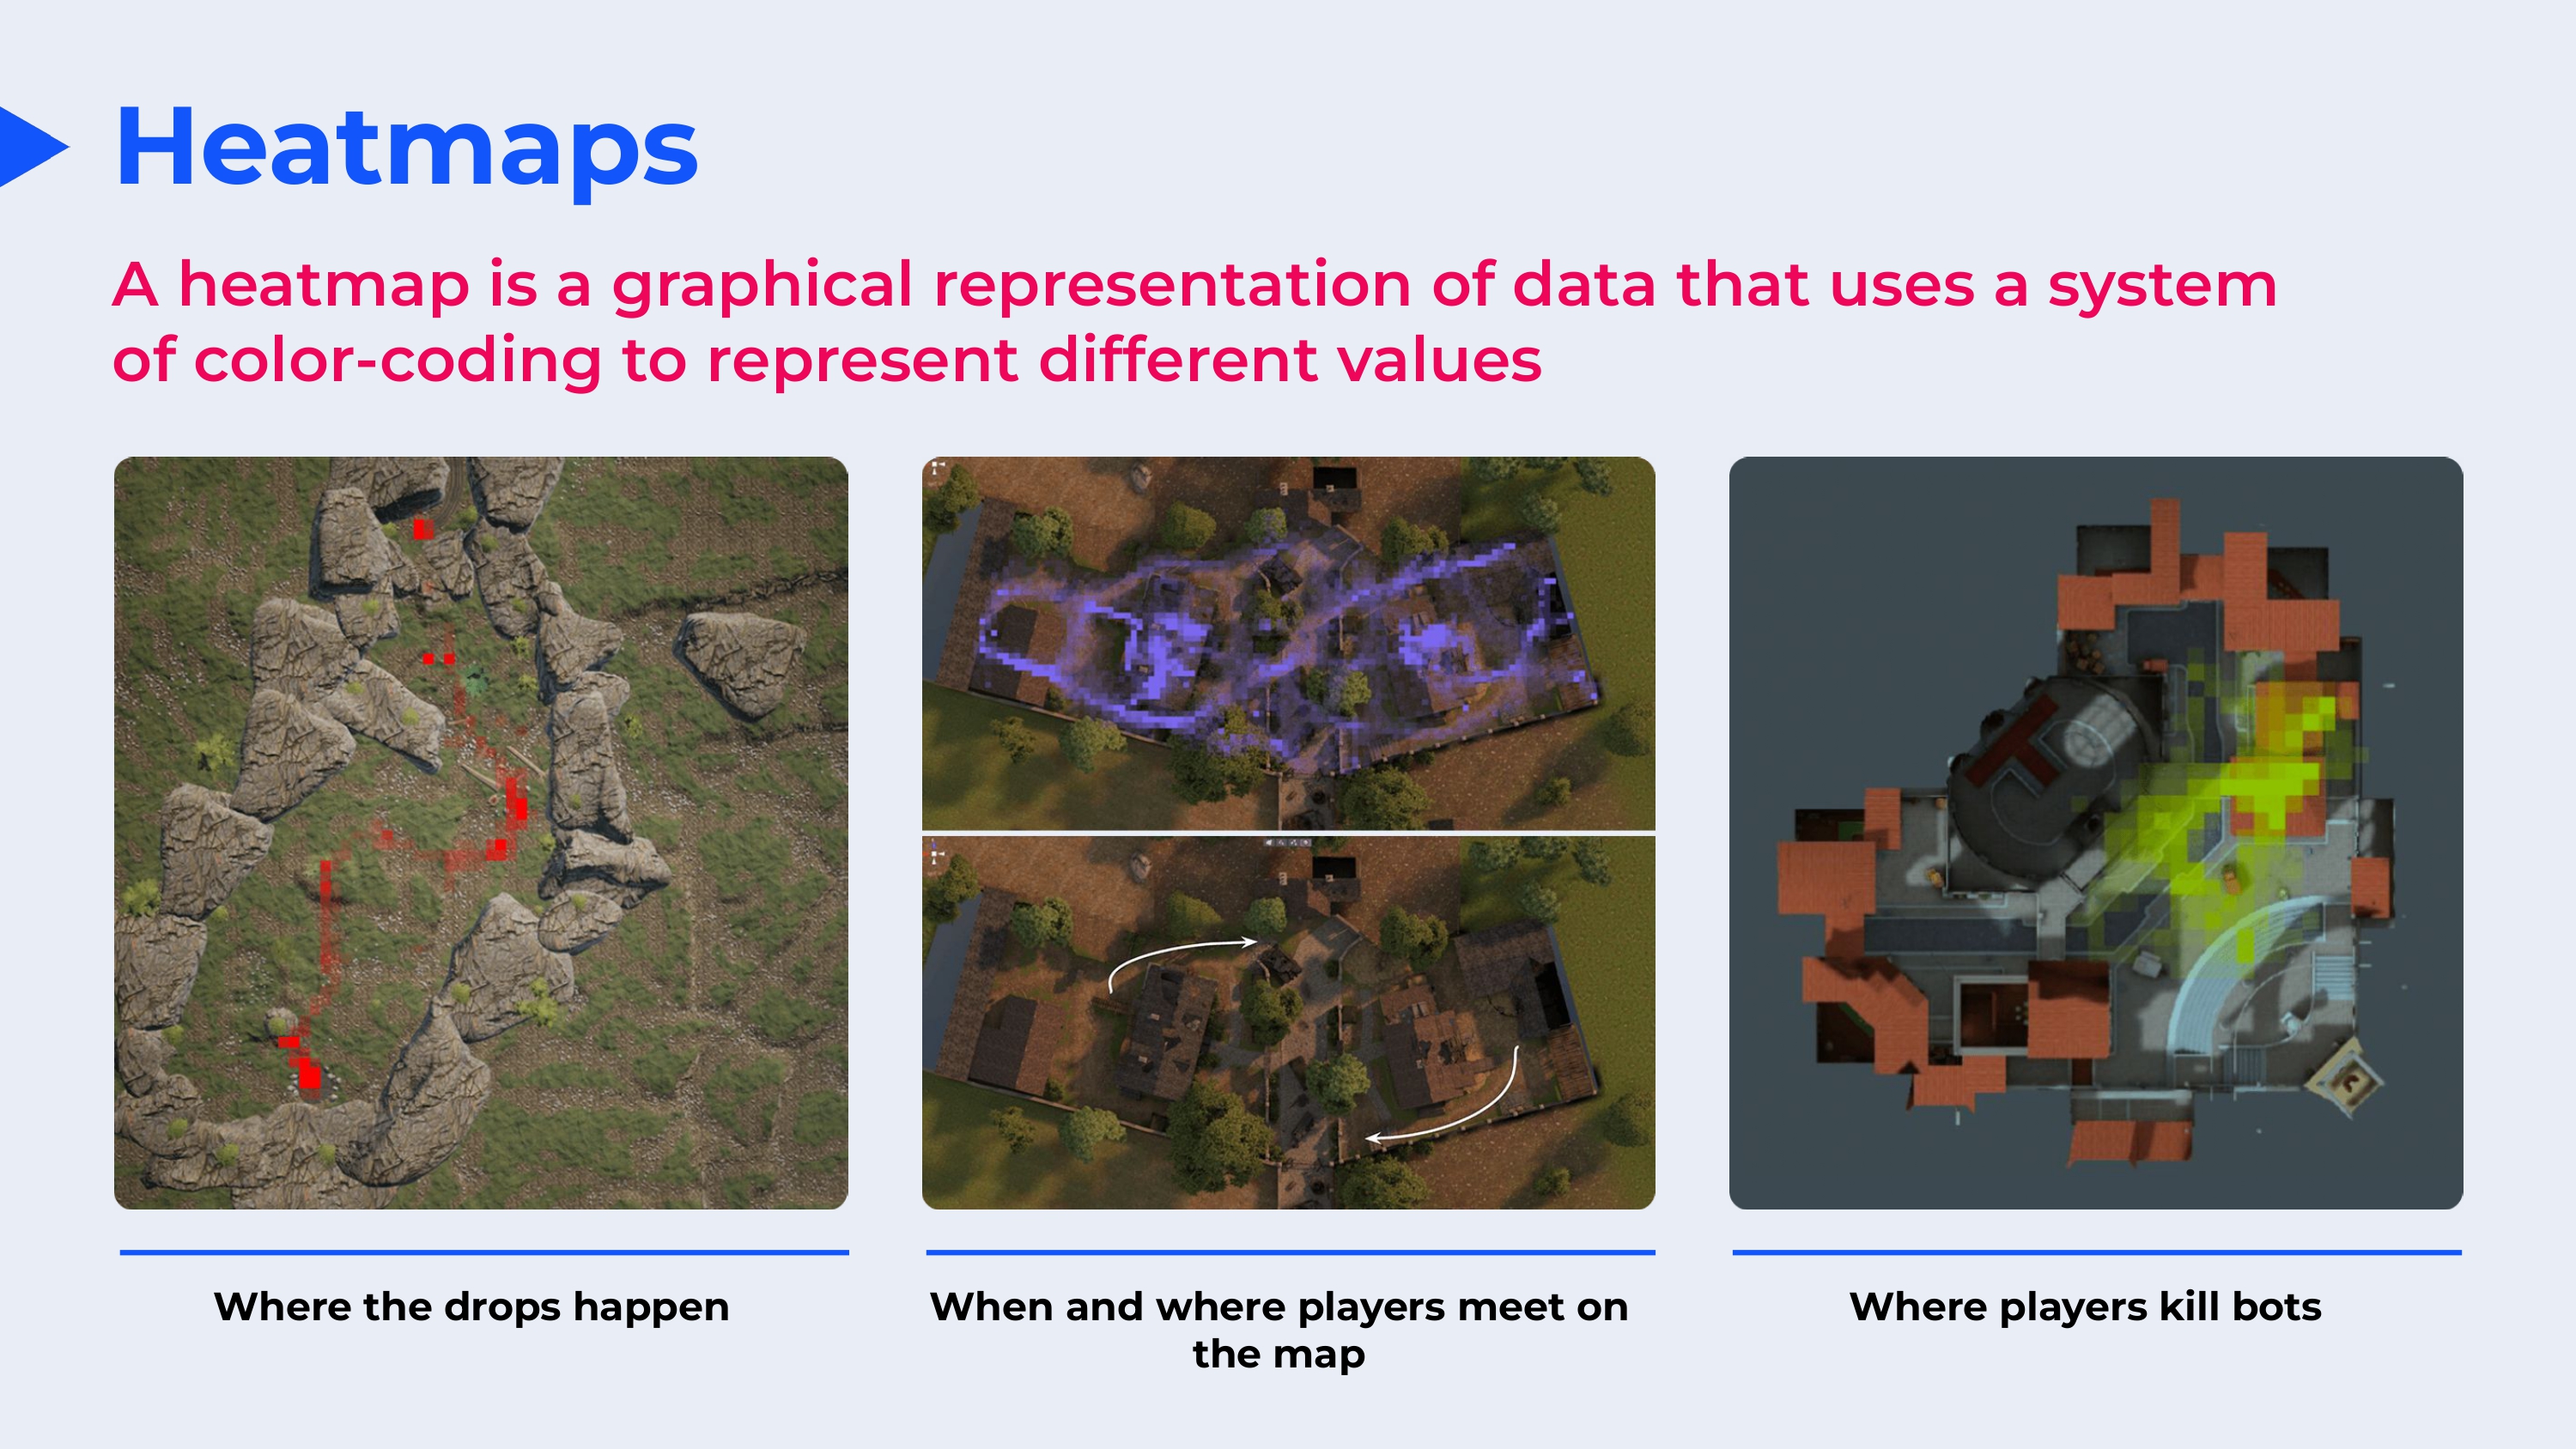
It is a graphical representation of data that uses a color coding system to represent various values. Here are some examples of using heat maps.
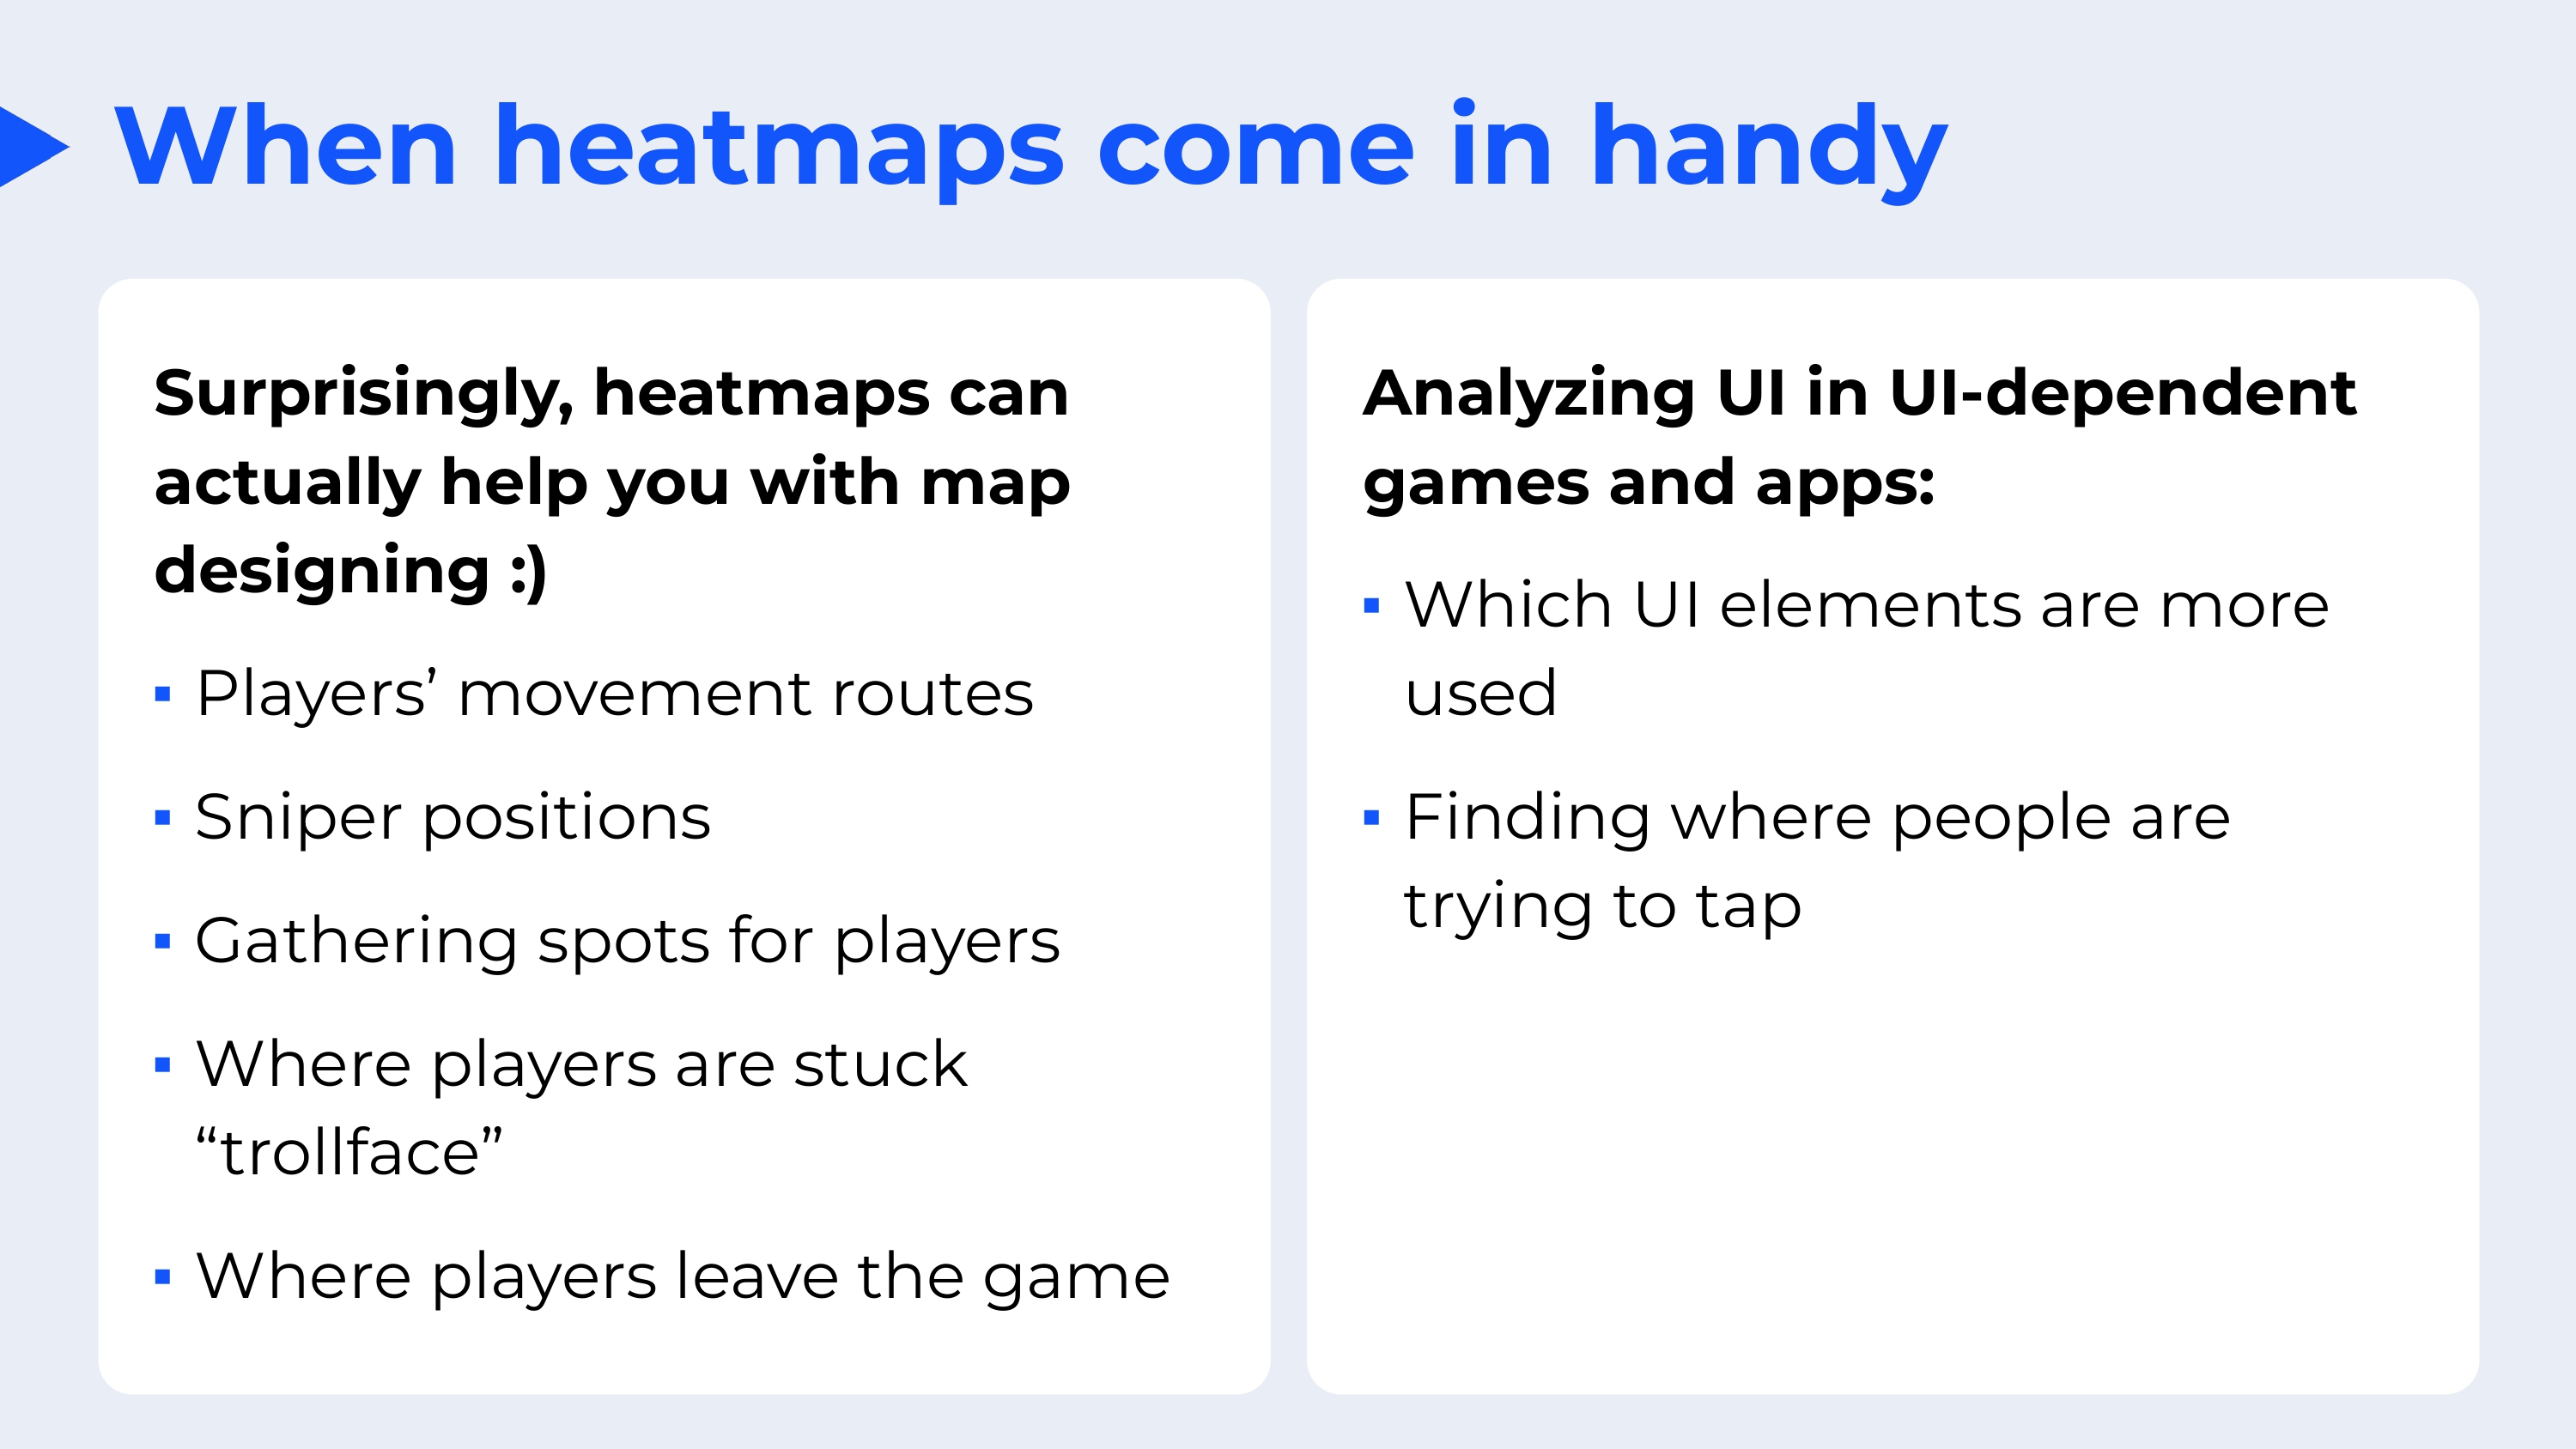
Surprise is a surprise, but first of all, heat maps can help you with level design. You can study the routes of players, sniper positions, gathering places of players, places where they get stuck or where they leave the game.
You can also use heatmaps to explore interfaces in UI-dependent games and applications, for example, to find out which user interface elements are used more often and where people click on the screen.
We mostly use heat maps on midcore projects, but that doesn’t mean you can’t use them somewhere else, even in hyper-casual games, if there are complex maps there.
Here is a case study of how we used heat maps in an off-road driving simulator.
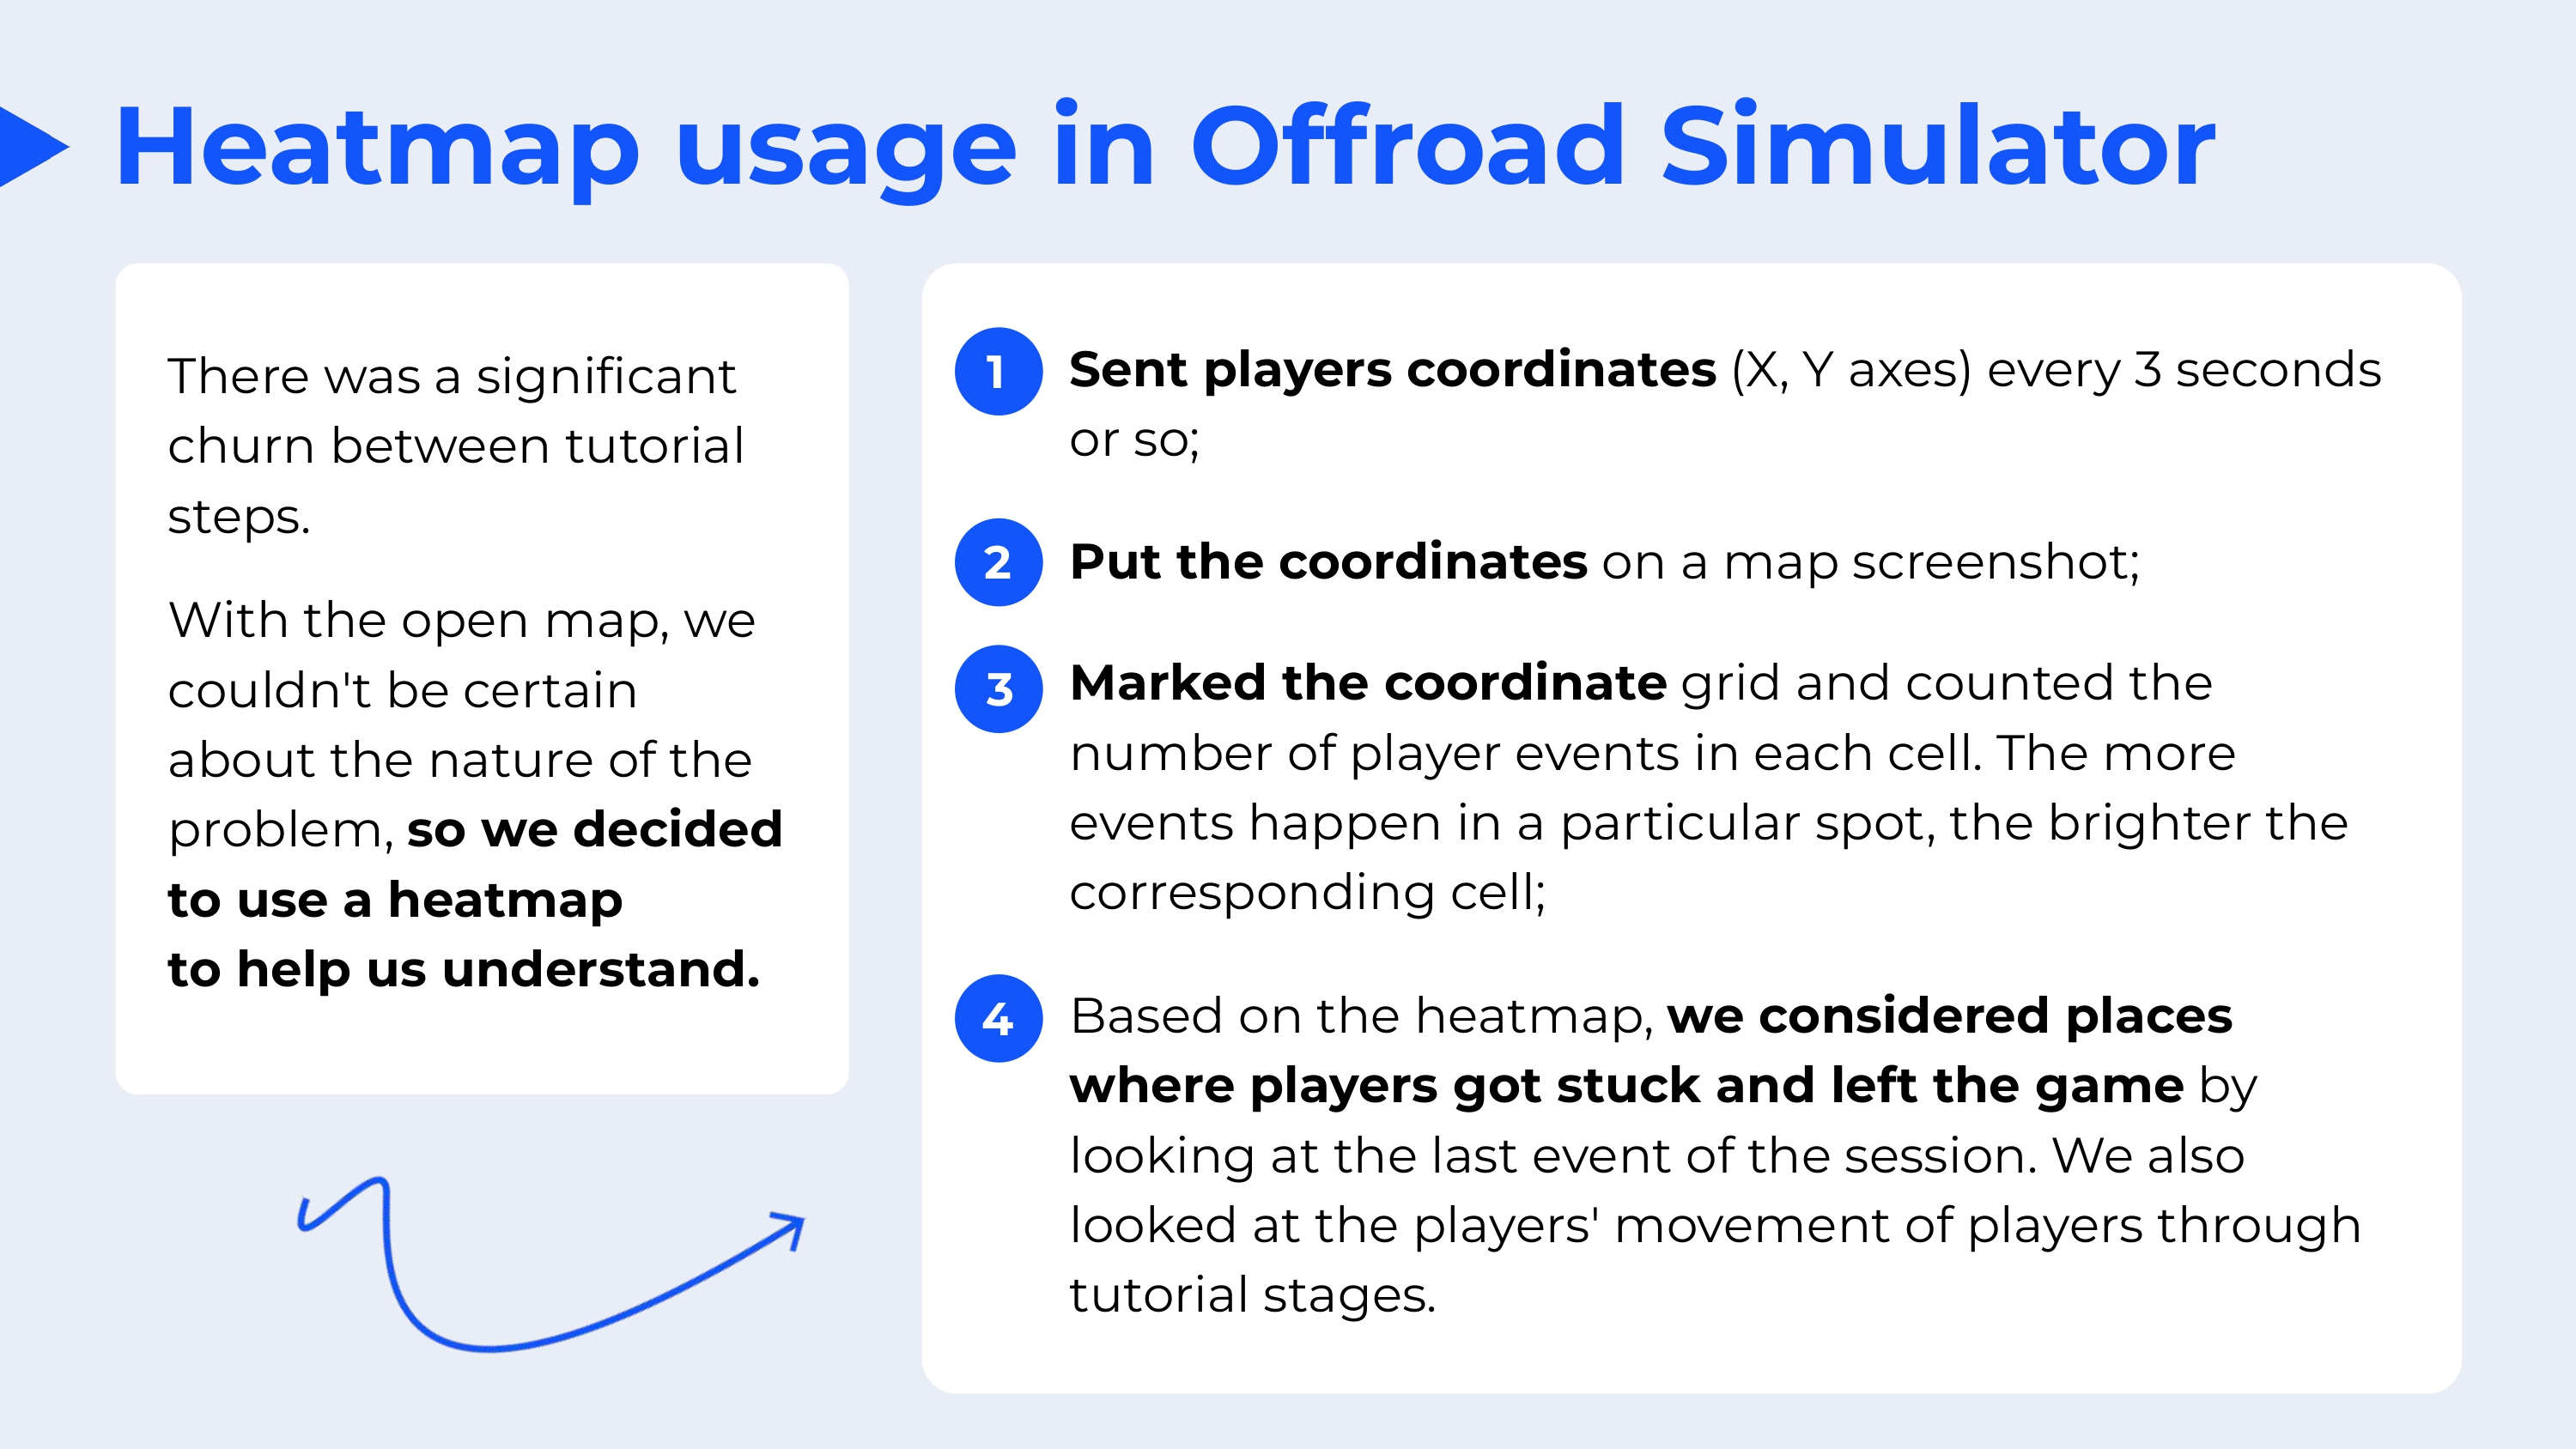
This is a game in which you need to drive a truck on difficult terrain using manual gear shifting, differential lock and other off-road driving techniques. We noticed a significant outflow of players between the stages of the tutorial, but could not understand the reason due to the fact that the map was very open.
Then we started sending the coordinates of the players to analytics about every three seconds. Then we put these coordinates on the map snapshot, marked the coordinate grid and counted the number of player events in each cell. The more events occur in a certain place, the brighter the corresponding cell.
Here’s what it looked like.
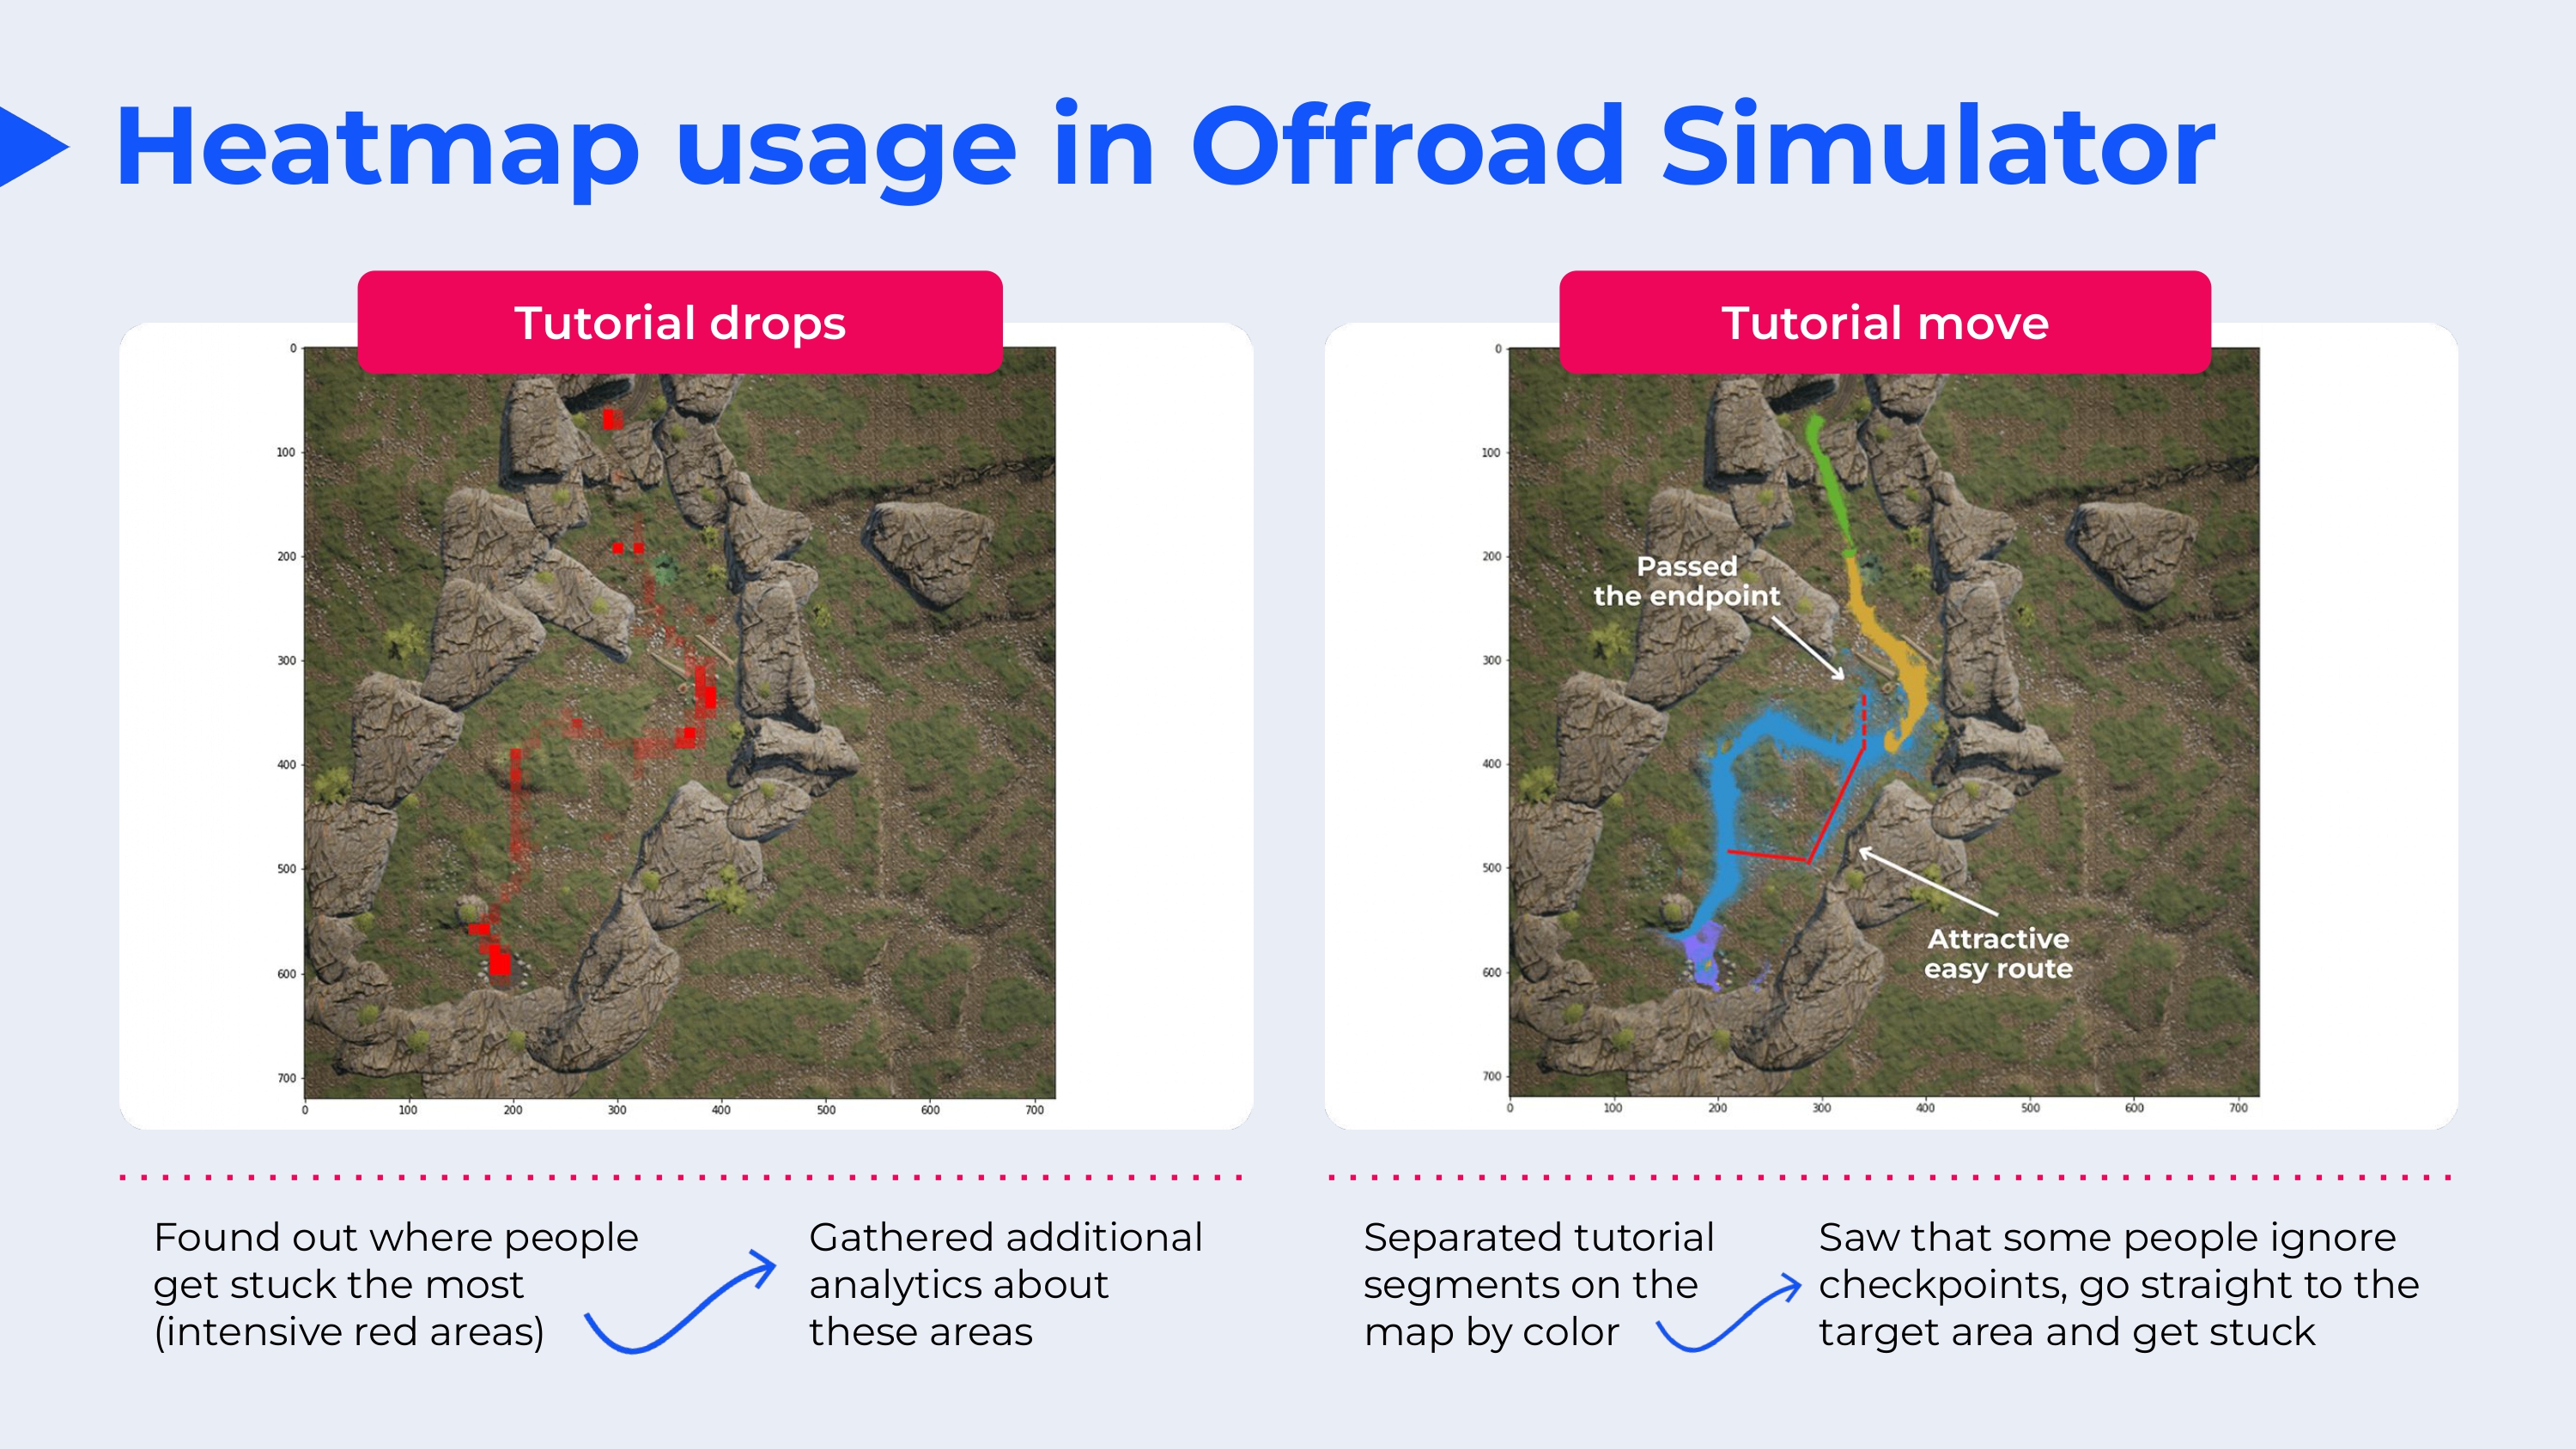
The intense red areas on the left map are the places where people got stuck the most. Knowing about these places, we were able to redo the map. We added a few training tips there to help people understand what they need to do.
We also divided the tutorial into complex segments by color and found that some players simply ignore the training prompts and go straight to the target point, which leads to getting stuck.
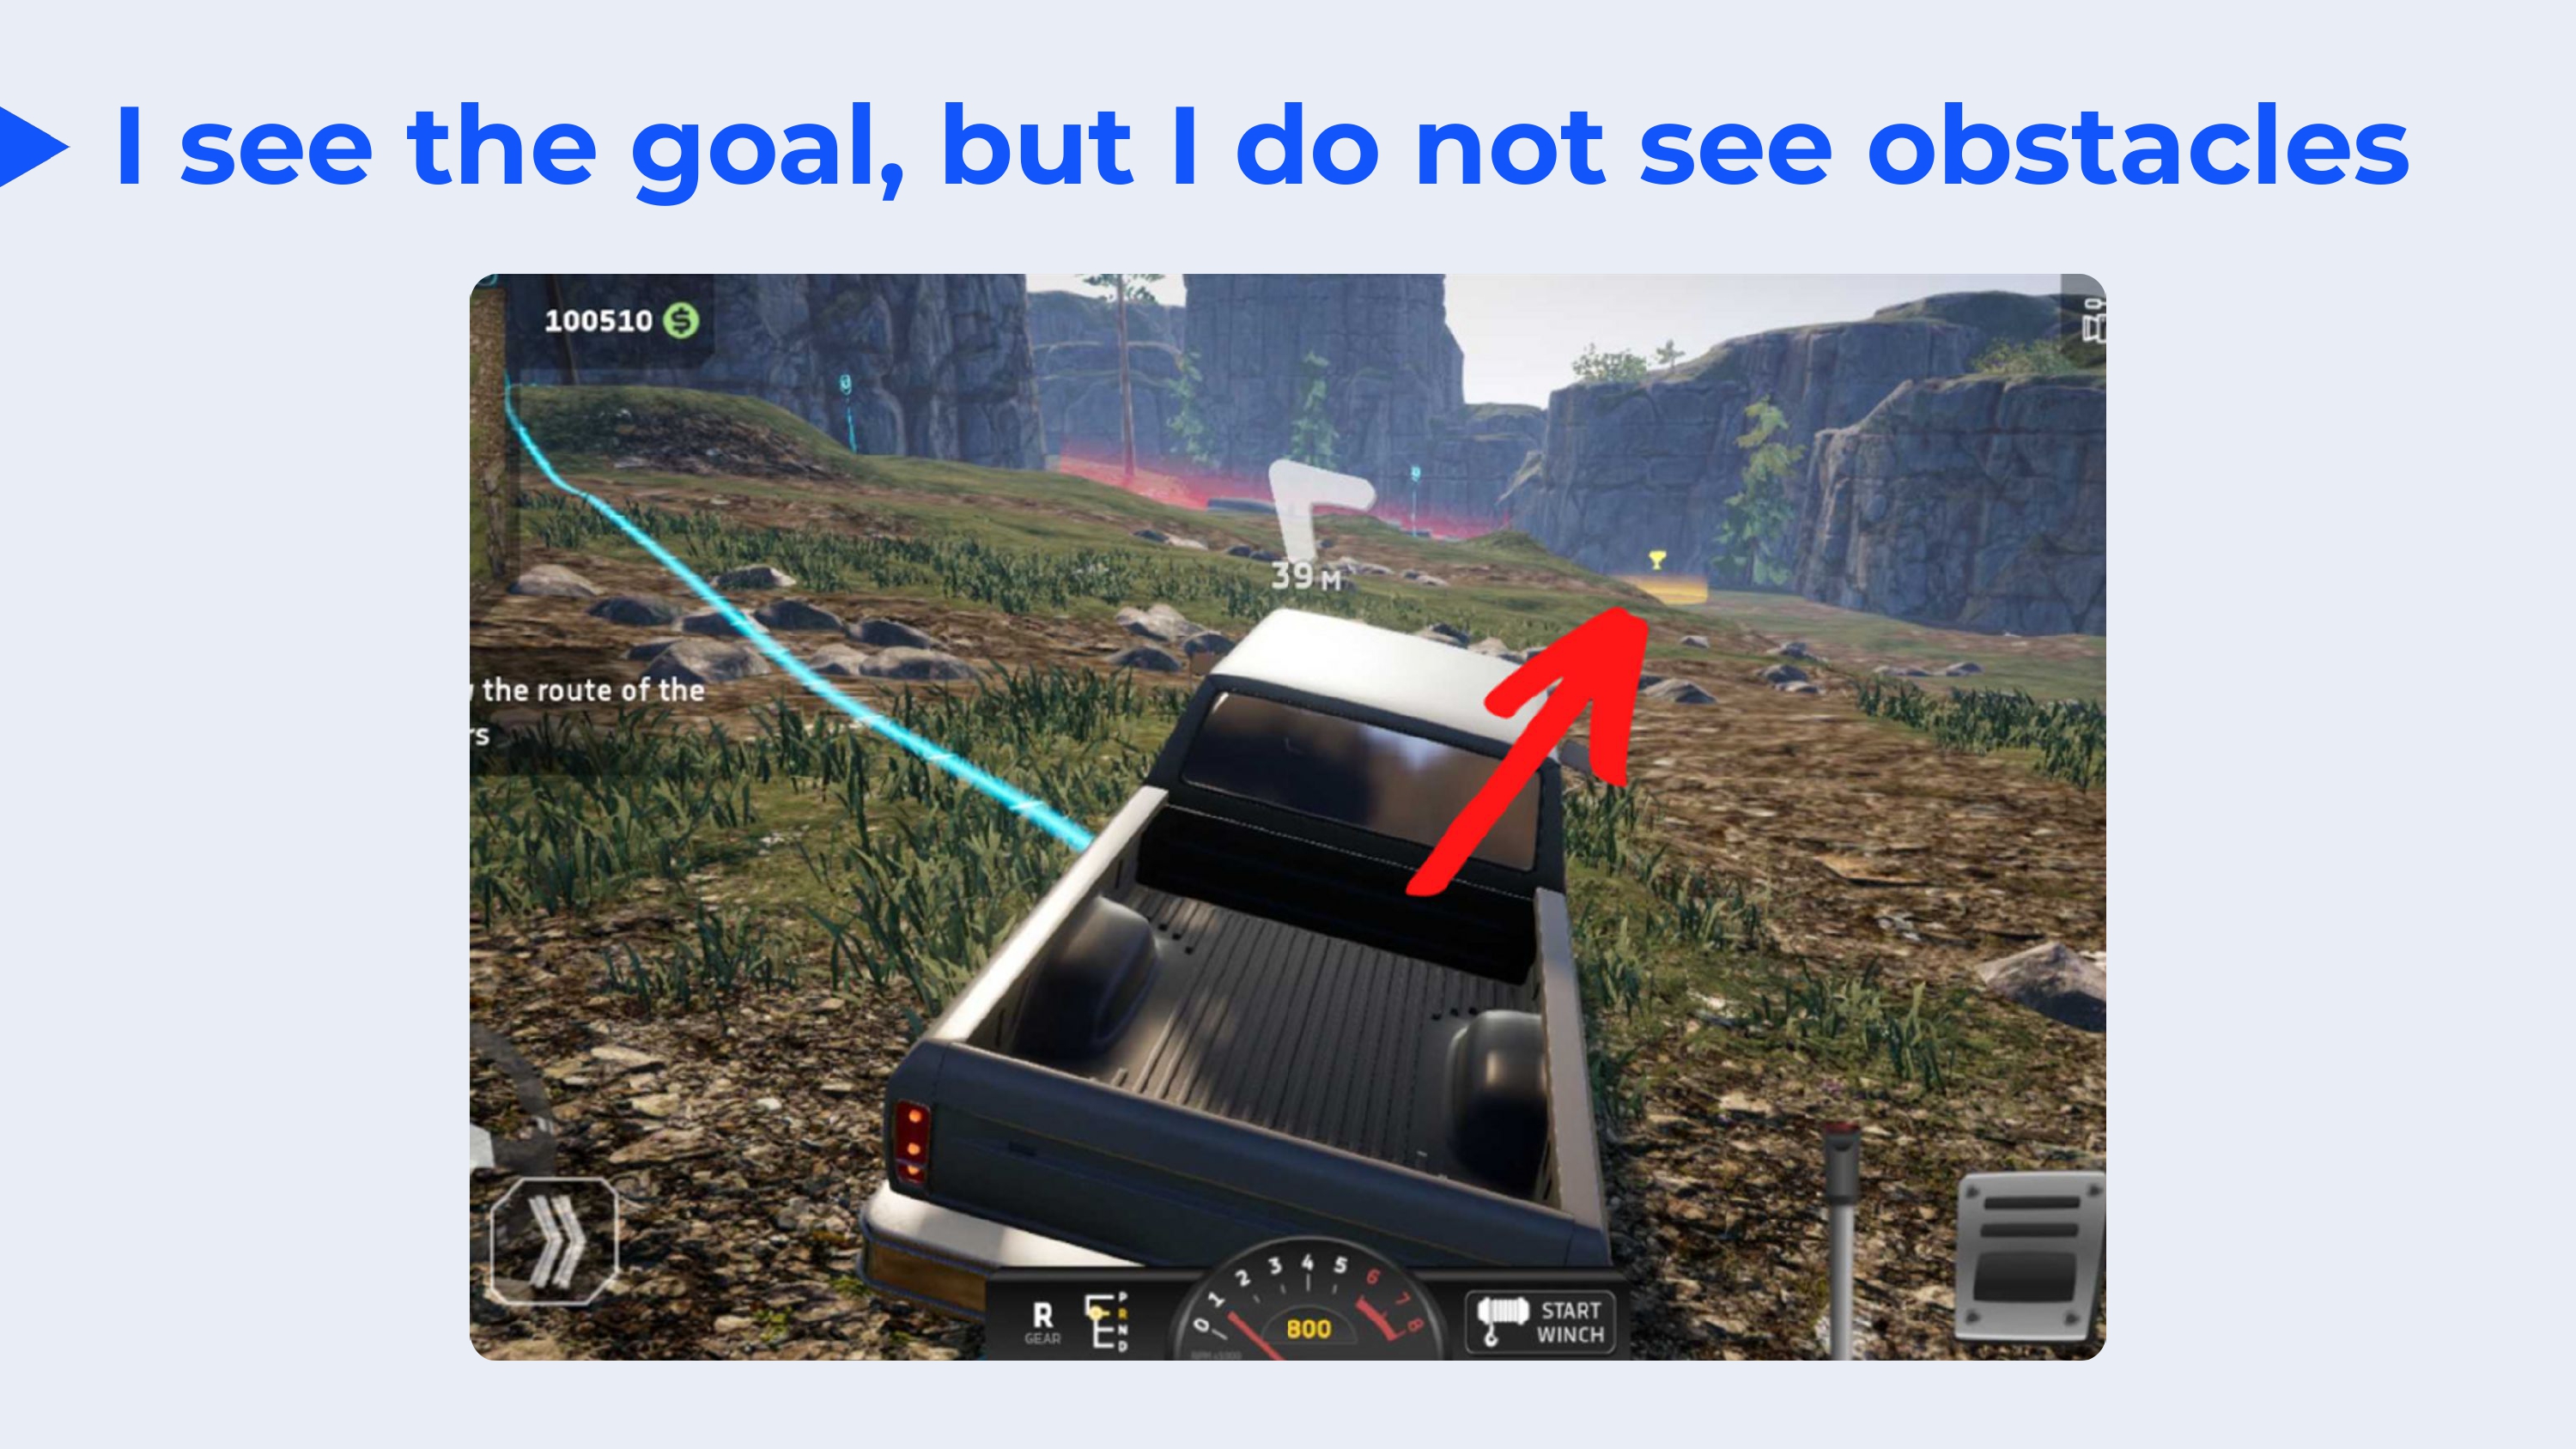
The blue line indicates the training path from one control point to another, and the red arrow indicates the final goal. So some people saw this goal from the very beginning and went straight to it and got stuck on the rocks. We found out about this only through the use of a heat map, and this helped to fix the problems and increase retention by about 15%.