
We continue to publish a series of articles “The Freemium Code”, compiled by Eric Benjamin Seufert, Head of Wooga Marketing Department. Today, an article by Valerie Coffman, the founder of an analytical company, is next in line Feastie.
The best mathematical model of viral marketing
Modern models of viral marketing for business communities are based on erroneous assumptions. As a result, the models themselves cannot reflect the real state of affairs.
But how can the business community build a realistic viral marketing model? How do I find out which factors (viral coefficient, time scale, user churn, market size) are most important? Fortunately, we have a lot of literature on mathematical models of viral growth (and decline), works that have been published since 1927. These models are ideal when talking about changes in the size of the market and the likelihood of a former user returning. Obviously, at that time, no one was thinking about YouTube videos or iPhone apps at a time when phones still had wires and dial discs. These models describe the spread of… viruses.
Model
The classic SIR model of the spread of the disease was made by Kermack and McKendrick (Kermack and McKendrick). I applied it to viral marketing by drawing an analogy between a disease and a product. The output result, of course, is very different, but the math is the same.
Kermak and McKendrick divided the total market population, N, into three groups.
- S is the number of people susceptible to the disease (potential customers);
- I – the number of people affected by the disease (current customers);
- R is the number of recovered (former clients).
The number of people in these populations changes over time. Potential customers become current as a result of successful invitations. The current ones become the former ones if they stop using the product. To simplify, I took the total market volume, N=S+I+R, as a constant number, and former customers as having received immunity. The parameters that regulate the spread of the disease are:
- β – infection rate (metabolic rate);
- γ is the rate of recovery (the level of outflow).
Suppose that current consumers, I, and potential consumers, S, communicate with each other at a level that is proportional to their number (which is regulated by the Law of Acting Masses). Thus, the number of new consumers coming to us from word of mouth or sharing in social networks.networks per unit of time can be calculated as βSI. The number of our users has increased by βSI, and the number of potential ones has decreased by the same number. This plays the same role as the “Virality Coefficient” in the Skok model, but it also explains the fact that the conversion rate from sharing slows down when the proportion of people who have already tried the product increases. In addition, we are abandoning the concept of “cyclical time”. Instead, we use the average time it takes to share something and the average frequency with which people do it, which is taken into account by the unit of time in the denominator β. Thus, β represents the number of successful invitations by the current user of a potential client per unit of time (for example, hour, day, week). I think this is a more reliable definition of the virality coefficient than what Rice and Skok used, since modeling viral exchange based on the time average determines the following facts:
- Users don’t share synchronized batches;
- Each user needs their own time in order to try the product, love it and share it with friends. Instead of setting the cycle time equal for all, β represents the average exchange rate;
- Users can invite others at the first attempt or after they have used it for a long time.
In this model, current users become former at a rate that is determined by the parameter γ. Thus, γ is the part of the current users that became former in a unit of time. It is inversely proportional to the time (1/t), and 1/γ is the average time in which the user remains a user. So if γ = 1% (users are lost per day), then the average user lifetime is 100 days.
Differential equations for virus propagation:
- dS/dt=−βSI
- dI/dt=βSI–γI
- dR/dt=γI
Analyzing the equations
These are nonlinear differential equations that cannot be conveniently solved to obtain the formulas S(t), I(t) and R(t). But they can show dynamics (especially changes in the size of the market and returning consumers). You can understand a lot by studying them and integrating them numerically. Let’s assume that t=0 represents the launch of a new product. Initially, only developers represent its consumers and are the user base, I(0). The initial number of former consumers R(0) is 0, and all the others are potential customers, S(0).
First of all, it is worth noting that the growing user base (dI/dt>0) will be at βS/γ>1.
That is, viral growth will continue as long as the addressable market is S(0) and the exchange rate β is significantly higher than the outflow rate γ. The model shows that with a large enough market, you can experience viral growth even with a small β, as long as the outflow is also small.
If in t=0 the number of S is very close to N, then βS/γ is approximately equal to βN/γ. Thus, if βN/γ>1, then the user base will grow, if βN/γ<1, it will not. In the epidemiological literature, it is sometimes also referred to as the “main reproductive number”. It is important that the “virality coefficient”, as Eric Rice called it, also depends on the size of the market and the outflow of users, as well as on the speed of viral exchange. This is approximately the average number of new consumers that each user invited to the product during the entire time he remained a user, which is why 1/γ. However, in the case of viral growth, βN/γ quickly ceases to represent the number of clients that each user has invited.
You can also see from these equations that if you ignore the change in market size (an approximation that makes sense for short-lived viral products like YouTube videos), the user base always converges to 0 over a long period of time, unless your churn rate is 0. After the number of current customers If dI/dt=0 reaches a peak at I=N–γ/β, the rate of change of users will become negative and their number will eventually drop to zero. This is consistent with Mashable’s data on the half-life of Twitter and YouTube posts. Again, note that the key role that churn plays in determining the peak of customers.
Examples
We can gain a greater understanding of these equations by numerically integrating them. In the examples, the unit of time for the problem β and γ is a day, although you can choose an arbitrary one. I define β as βN in order to more correspond to Rice’s concept of the viral coefficient – if at the moment t=0 the number of S(0) is approximately equal to N, then βN is the number of new consumers that each existing user accesses per day.
Setting:
N = 1 million people in the market.
βN = 10 invites from users to knocks
γ=50% of users are lost in knocks
I(0)=10 initial users
and numerically integrating the equations given above, we will get a picture of how the number of users changes during the first 30 days:
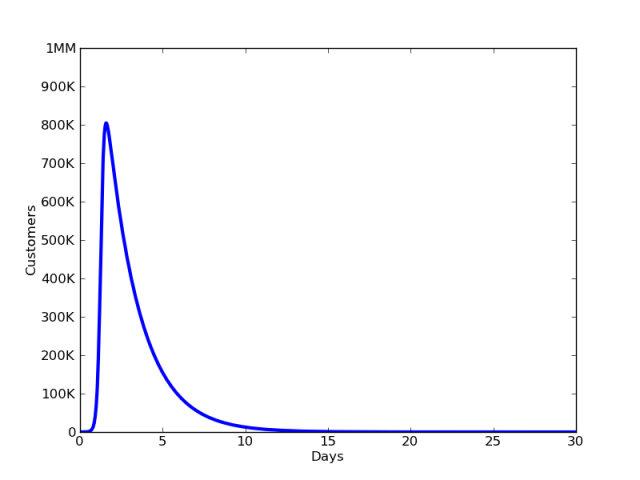
This graph is similar to the spread of popular Tweets, when traffic rises sharply and then subsides, as people get bored with the topic.
For a lower level of churn, γ = 1% of users are lost in knocks, we see the following picture for 300 days:
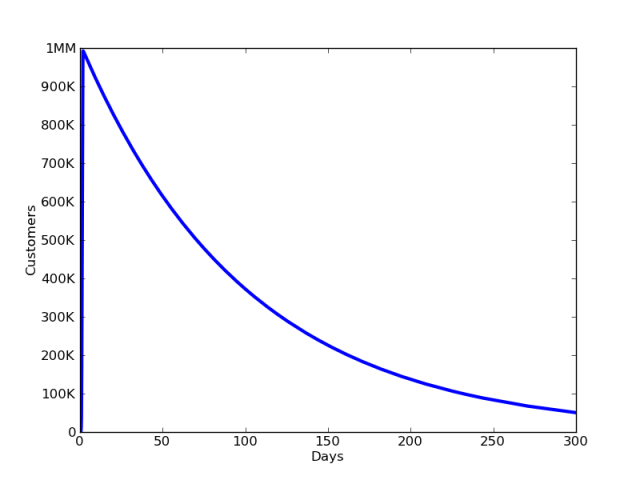
This shows us that even with small outflows, without new potential users coming to the market, or without the return of former users, the user base always decreases after reaching its peak. Note also that the smaller outflow allowed us to achieve a greater peak in traffic.
How can we maintain a steady viral growth? To do this, you need to understand how viral marketing affects the changing size of the market.
The article was published as part of a joint series of materials “The Freemium Code” of mobile development sites App2Top.ru and Apptractor.ru .
Original material: http://datacommunitydc.org/blog/2013/01/better-science-of-viral-marketing-part-2/
Original translation: http://apptractor.ru/marketing-monetization/engagement/luchshaya-matematicheskaya-model-virusnogo-marketinga.html