Producer Egor Vasiliev wrote a lot of material about the experience of cloning a game in the genre of “spot the difference”. He talked about budgets, difficulties during development, softlonch, release and first results.

Introduction
A year ago I was looking for a job. He had nine years of experience in the gaming industry, including six years as a producer. This experience did not prevent me from being afraid to stay out of business, without money and die in poverty and obscurity. After about 15 interviews, there were offers from major studios in Moscow, Kiev and Minsk for a salary of $ 4+ thousand. I was in no hurry to accept these offers. I missed the challenge.
Conditionally, it was possible to sit in the office as a “monetization producer” and come up with offers for a super successful match-3 with a five-year history and an annual income of several million dollars, but this is not what I loved my job for.
It seems to me that the most beautiful thing in the work of a producer is to go “into the field”, where there is nothing yet, and assemble a team from scratch, build a development process and bring the product to the softlonch, and then to the release. That is why, when Dmitry wrote to me with a similar proposal, we got on the phone pretty quickly and started discussing the details.
Dmitry and his partner were engaged in mobile applications. They bought ready-made apps with organic traffic, twisted monetization, beat off costs and then resold. There was no experience in game development, but there was a desire to try. Their attention was attracted by the game 5 Differences Online from the SmartProject studio located in Dnipro.
The core of the game is the search for differences between two pictures with one interesting feature. The player was looking for differences at the same time as other players. The one who found the last one was eliminated, the rest moved on to the next round. A kind of casual battle royale.
In meta, too, everything was simple — daily quests for short-term retention, weekly tournaments for medium-term and collections for long-term. Monetization was based on hints — the player could buy a hint that immediately highlighted one of the differences in the picture.
I went to the App Annie to look at financial indicators. The game earned $40 thousand a day from each platform. $2.5 million for January 2020. Until January — stable $ 500 thousand per month. It was decided to make a clone.

Money
The main question that needs to be answered at the very beginning is how much it will cost. I use the following methodology for calculating the cost of development.
First of all, I determine what kind of expertise should be in the team. In our case, this is:
- game designer. It is necessary to decompose the original game, write documentation, drive the balance numbers into the admin panel. The tasks are quite routine, no special talent is needed. I pledge $1000 per month, full time;
- Unity is a developer. There is nothing to comment on here in general, a confident middle developer is needed. $2500 per month, full time;
- server developer. It is necessary to implement PvP, return of content (pictures with differences), validation of purchases, server configs for quick testing of changes. $1500 per month, part time;
- 2D artist. It is necessary to draw 9 locations-episodes and a loading screen. For a softlonch, you can do with less 2D graphics. $2000 per month, full time;
- content artist. It is necessary to prepare interfaces, items for collections and the actual pictures themselves with differences. $1500 per month full time;
- producer (that’s me). The actual organization and management of the process. $2000 per month full time.
In total, the burn rate of the team is $10.5 thousand per month. I always consider salaries a little higher than the market. Firstly, it allows you to hire really talented, in-demand specialists on occasion (which actually happens infrequently). Secondly, if the deadlines are shifted, it will allow not to get out of the budget.
The next step is writing a roadmap. To do this, I make a list of mechanics in Trello that need to be implemented. Inside each mechanic, I roughly indicate the subtasks (for an approximate understanding of the development time) and mark who from the team will work on this mechanic. It turns out this description:
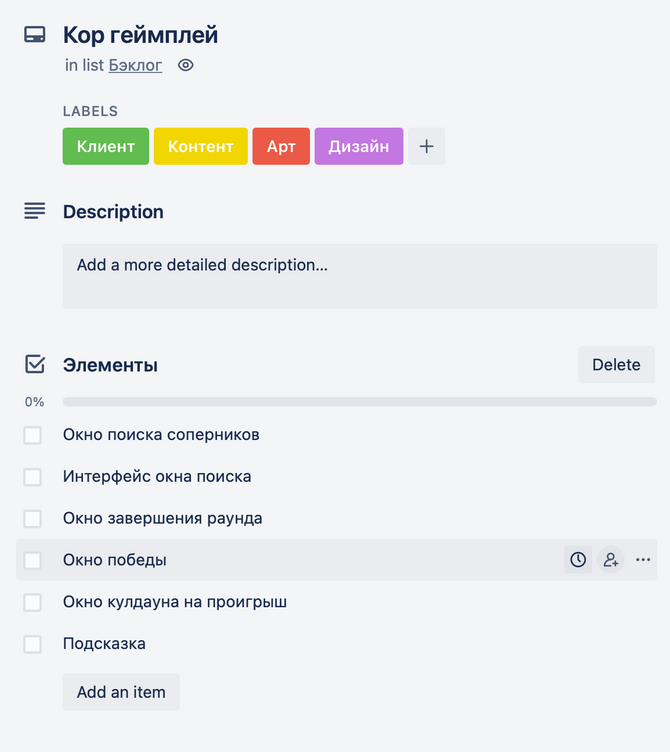
An approximate description of the game mechanics
Next, I spread the mechanics by months and assemble the roadmap myself. At the same time, I pay attention to:
- the order of development — you should not do the mechanics of collections until the core gameplay is ready;
- developer workload — the load on team members should be distributed evenly;
- development time — I estimate how many weeks it will take to develop a particular mechanic.
With deadlines, it is important to understand one thing. The development of mechanics consists of two parts, conditionally “head” and “tail”.
The “head” is the implementation of mechanics, as described by the game designer. The “tail” is a refinement of mechanics, namely, polishing of uncritical bugs, balance testing, possibly experiments with visual. For short mechanics and for particularly important mechanics at the planning stage, the “tail” is equal to the duration of the “head”. For the rest of the mechanics — half as much. At the same time:
- for critical mechanics, the “tail” can be infinite;
- at the planning stage, the “tail” can and should be both cut and lengthened in order to optimize the development process;
- in case of errors in planning, first of all it is necessary to cut the “tails”.
As a result, the following table is obtained:
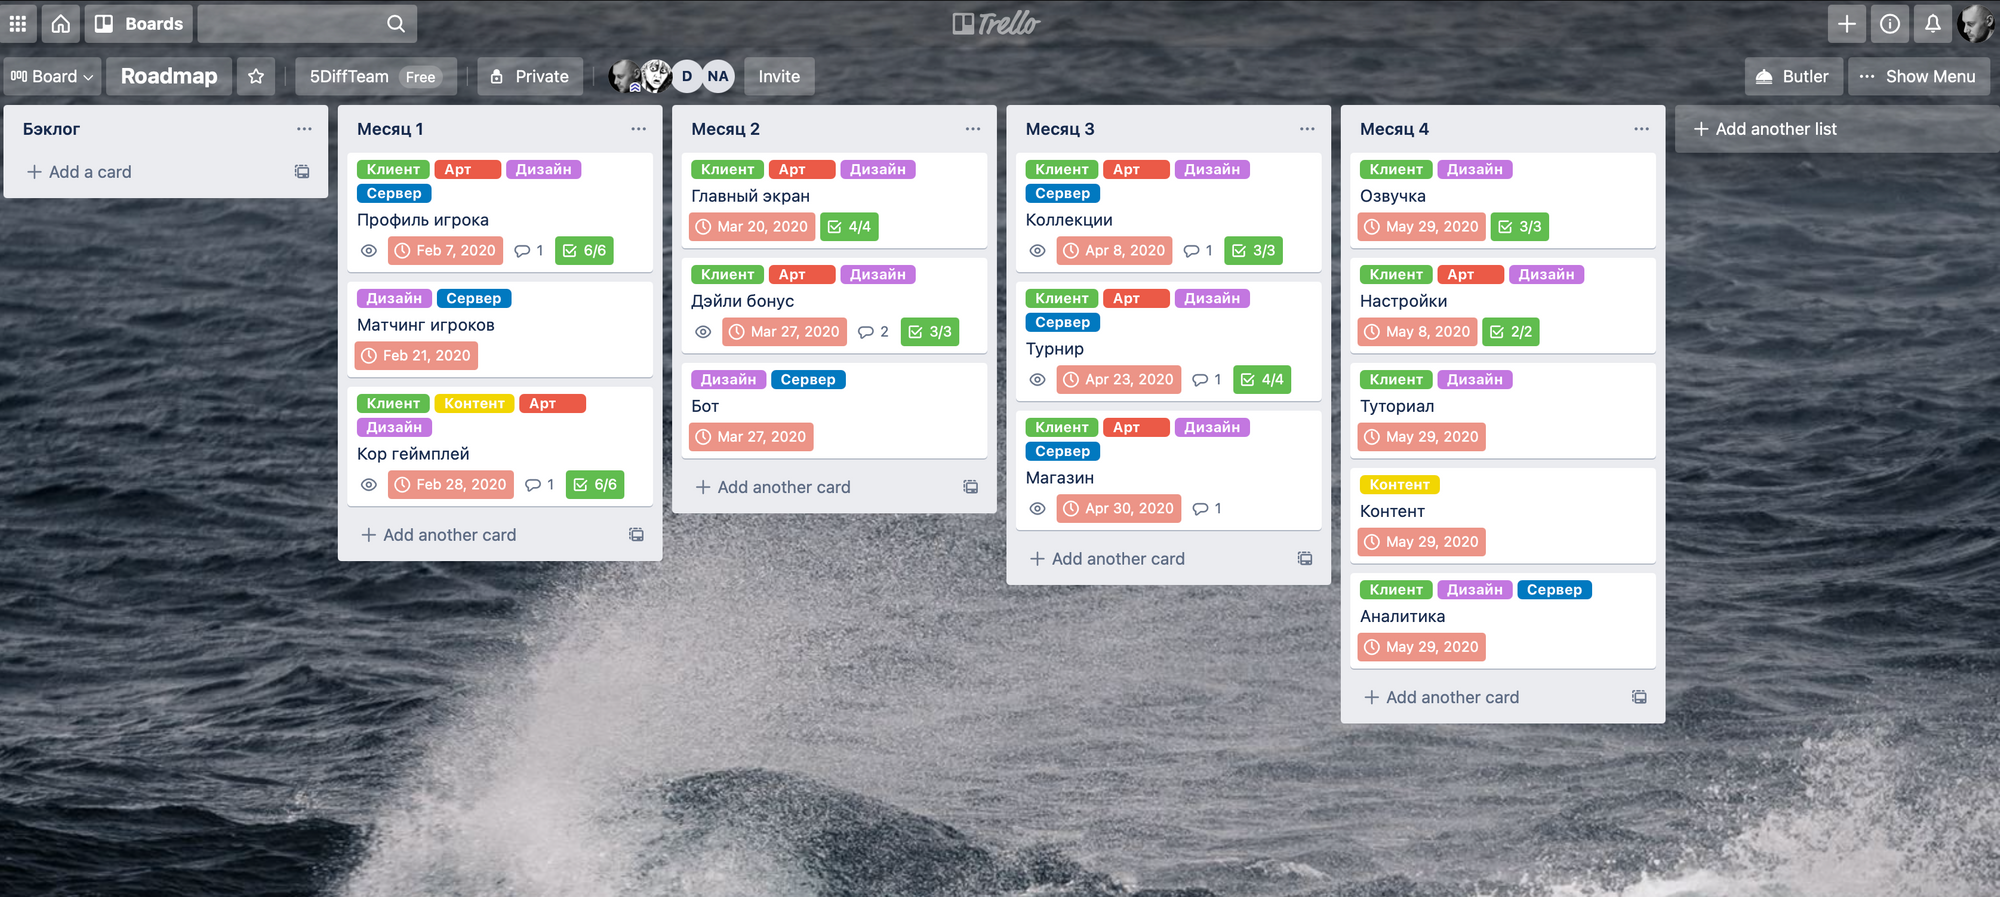
Project roadmap in Trello
According to this table, we can see who, when and what is working on. And most importantly, it becomes clear that the development time will be 4 months, and the cost will be $ 42 thousand. I also usually put additional risks in 20% of the total budget in case something goes wrong.
In total, the required budget for development is $50,400.
This budget does not include a softlonch, since it is impossible to predict in advance either the duration of the softlonch or the cost of traffic. It is necessary to proceed from your own financial capabilities.
Before proceeding to the description of the development process, it is worth noting one important detail. I had experience cloning games and I knew that when the project’s performance was lower than the target after the launch, first of all I would want to redo what was different from the original. Therefore, from the very beginning I insisted that in the first iteration all the mechanics were copied as accurately as possible.
In addition, there were two dark spots. The first is everything related to the complexity of the game. The second is bots. We could not decompose the internal structure of these mechanics. On both sides, we had only our own subjective perception, which, moreover, was different for everyone.
Development
Before the start of development, there was one unresolved issue. I didn’t like that the original seemed to have no visual and ideological commonality. I couldn’t identify the setting of the game. I would like to make our game more holistic.
To do this, I chose several popular casual themes and, through Facebook Audience Insights, checked the intersections with games of the HOG genre, which seemed to me the closest to ours. The result is this table:
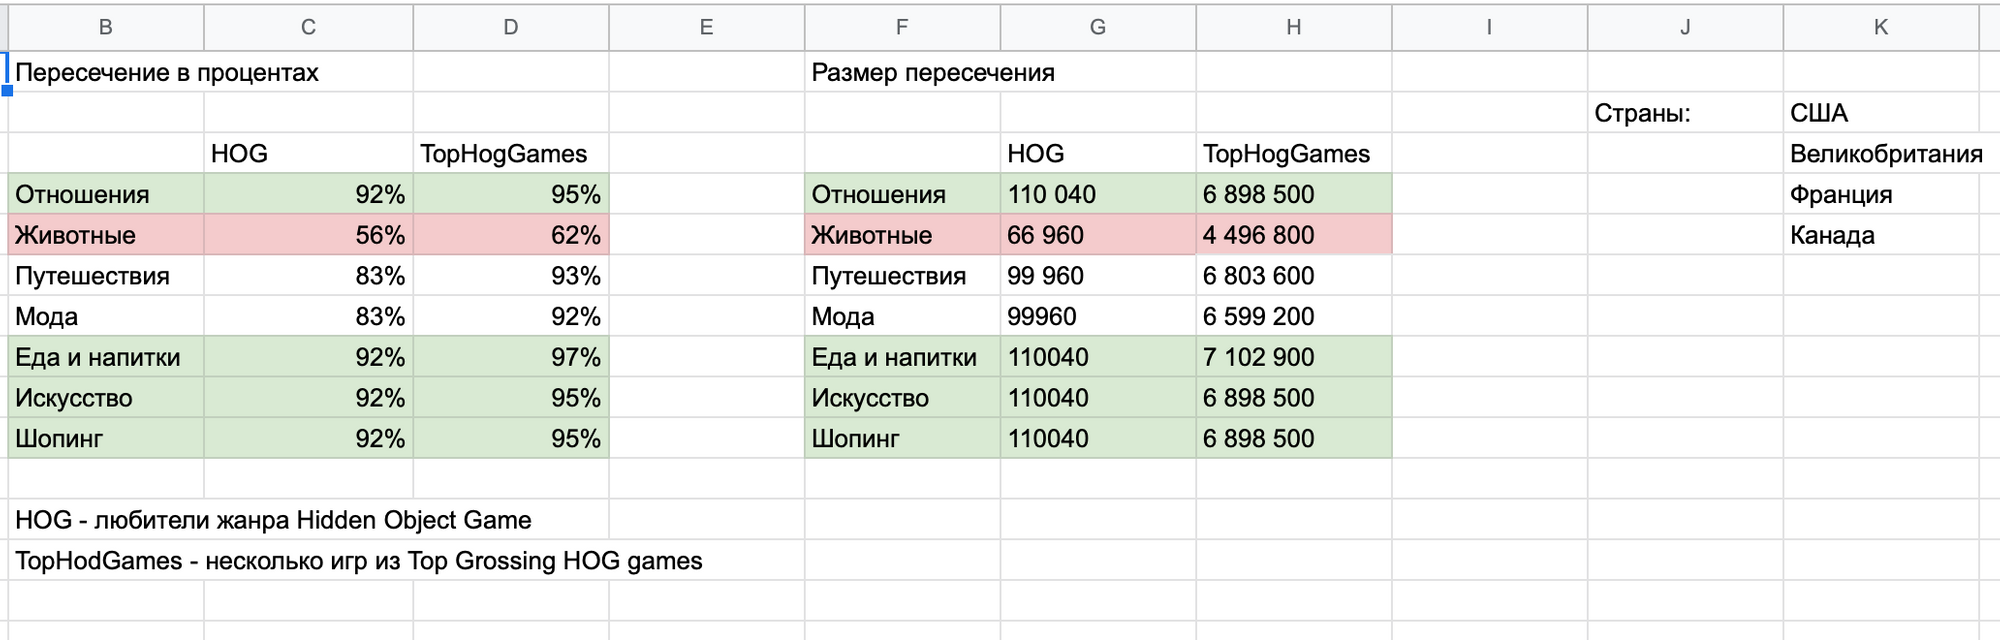
Analysis of the popularity of various settings
Our choice fell on the setting “Food and Drinks” — we tried to do all the visual in the chosen theme.
Then I started assembling a team. I used the following resources to search for people:
- groups related to the gaming industry on Facebook;
- channels related to the gaming industry in Telegram;
- the vacancies section on dtf.ru and hh.ru ;
- forum Gamedev.ru .
I can’t say that my experience is representative enough, but I am of the opinion that it is most effective to search for developers on Telegram, artists on Facebook, and game designers and testers on Gamedev.ru . Search for people on specialized sites like dtf.ru or hh.ru in my case, it doesn’t work because I have to compete with larger, well-known companies.
It took two weeks to assemble the team and in mid-February we started development.
One of the most important issues remained the implementation of the mechanics of differences and what kind of content should be for it. The main problem was that inside the level all the pictures had the same number of differences, but from level to level it varied from 5 to 10. And since the player could play and replay the same levels several times, it was impossible to calculate exactly how much content was needed for each level.
As a result, this problem was solved as follows. The pictures were taken from the stock, our photoshop master drew 12 differences for each of them. We saved all the differences for each picture in a separate file, in the places where they should be. The result was these pairs of pictures:
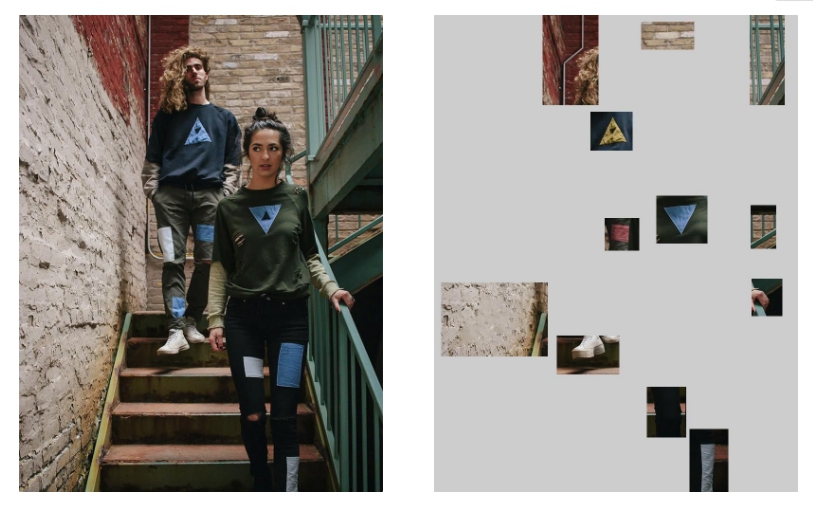
Such a system allowed us, firstly, to use the same picture in any levels, regardless of the required number of differences. Secondly, for players who have already gone through all the content, we could reuse the pictures, but with other differences.
After two and a half months of development, almost all the necessary mechanics were implemented. Despite the fact that everything still looked very damp and overloaded, we began to prepare for the softlonch. In order to speed up the process, it was decided to strengthen the team with another Unity developer.
“You have fundamental problems with the game, I’m afraid it’s far from release here,” said the new developer after getting acquainted with the source code of the project.
I found myself in an unpleasant situation. On the one hand, there were really a lot of bugs, but this is a typical situation for a game at such an early stage of development. In addition, almost every developer likes to criticize the work of colleagues and wants to redo everything for himself. On the other hand, I lacked the technical expertise to really understand and assess the scale of the disaster (and whether it exists at all).
The situation was aggravated by the fact that the first developer was hospitalized with coronavirus for an indefinite period. The decision was extremely difficult for me. Despite the fact that usually from a business point of view, the decision to redo everything is terrible, I still gave the go-ahead for alterations. I reasoned like this: if you force a new developer to work on existing code, it will demoralize him, which means that we will lose for a long time because of the possibly really low quality of the code and because of the increase in development time due to the low motivation of the new team member.
The alterations took a month.
Softlonch
On June 5, 2020, three and a half months after the start of development, we entered the softlonch. At the start, the metrics were depressing.
But first, a little bit about the softlonch strategy itself. We decided to start with Latin American countries, namely Mexico, Argentina, Chile. Firstly, these countries are much cheaper to purchase than traditional Canada, Australia and New Zealand. And secondly, these countries are closer to the USA and Europe in mentality than the countries of Southeast Asia, which are also often used for softlonch. The platform is Android, so it’s cheaper.
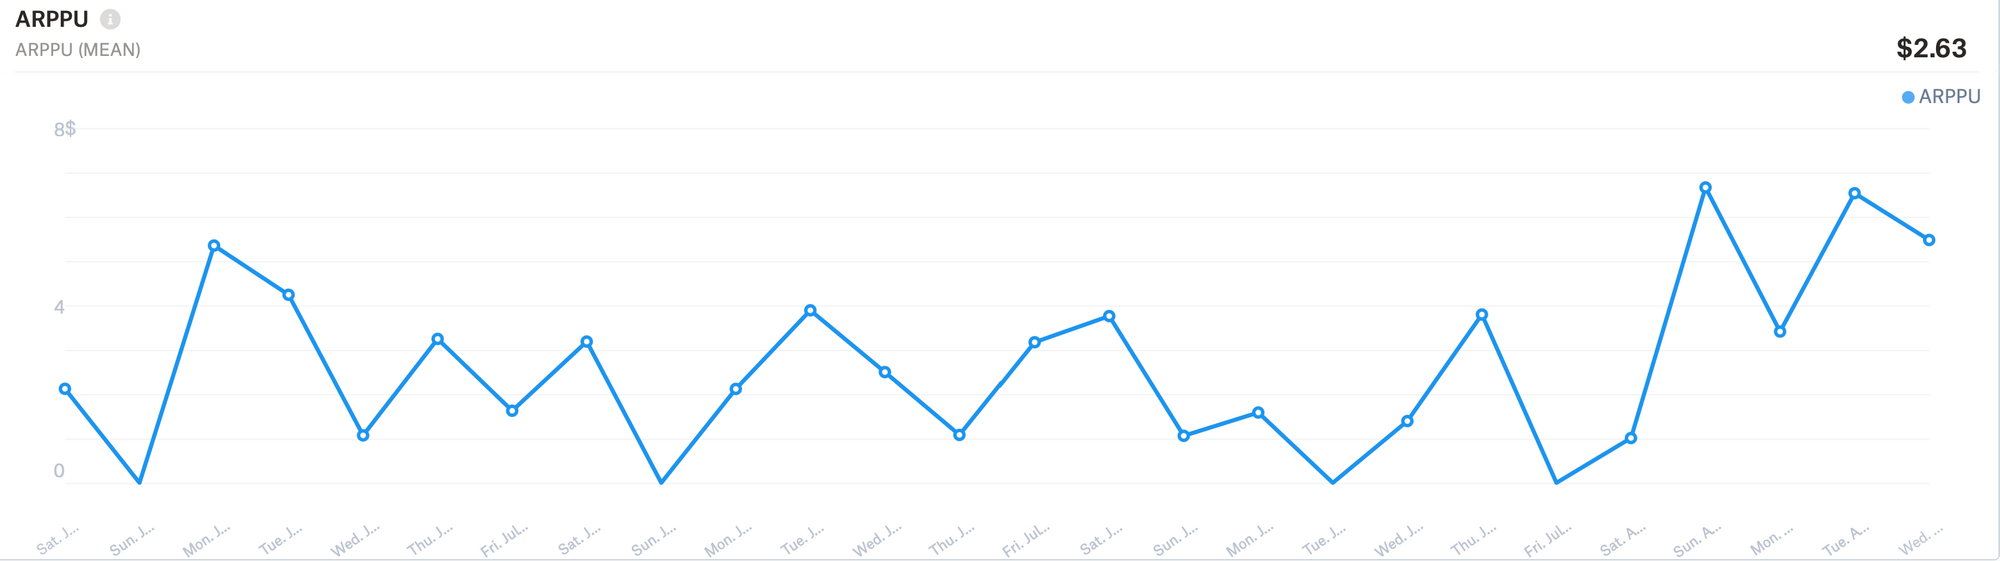
At the start, the retention of the first day barely reached 25% with a benchmark of 35%. It’s not worth talking about the other metrics. We began to look at the statistics for the first session and found significant dumps. There was a hypothesis that the starting pictures are very complex. We have redesigned them, making them simple due to bright, well-marked differences. Retention has grown to 40%. Then we experimented with the starting pictures (a failure on the chart in mid-June) and reached a stable 40%+.
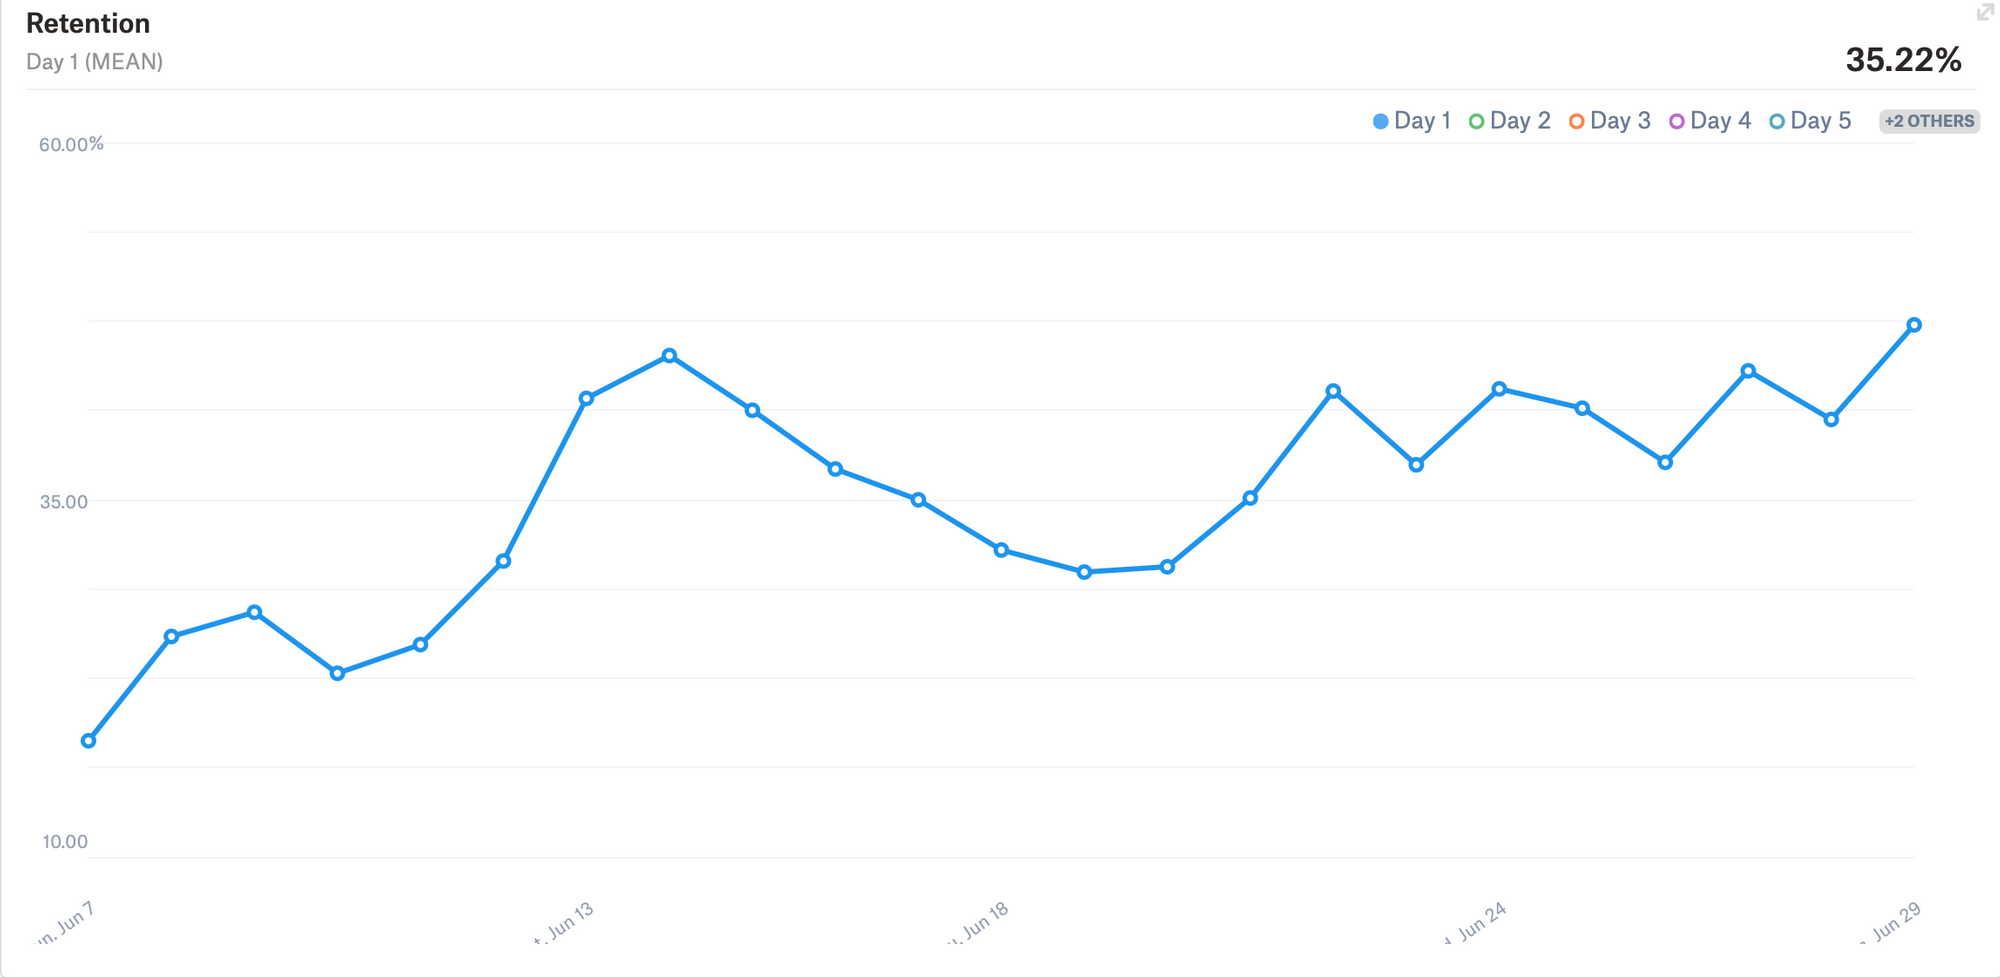
Retention schedule of the 1st day after launch
After the retention of the first day, the retention of the seventh day reached the desired indicators — 15%+. In anticipation of the indicators of the 28th day, we shifted the focus to monetization.
Everything was so bad with monetization at the start that the first thing we did was to check if we had any technical problems with the store and purchases. There were no technical problems. Shopping too. In search of money, we got into the statistics.
It’s time to tell you how we organized the collection of statistics and analytics. To quickly track key indicators, we used Game Analytics, a free tool that allows you to monitor the main indicators of engagement, retention and monetization. You can split the selection, for example, by advertising campaigns, countries, or versions of the application. The latter, together with the ability of Play Market to pour the build on a part of the audience, gives a free A/B testing tool:
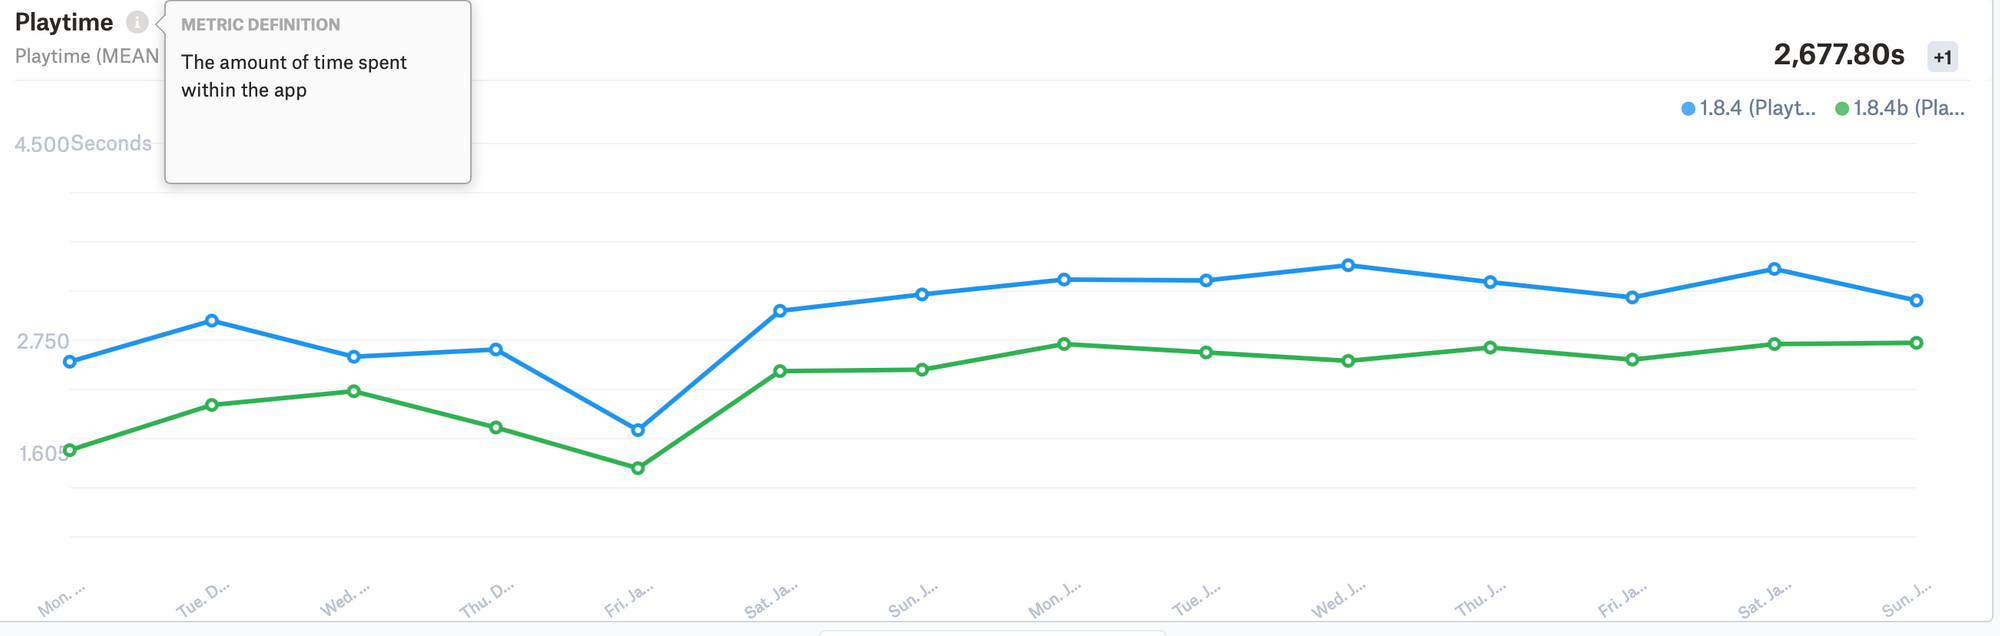
Example of A/B test
Sometimes I want to double-check if there is an error in the statistics. To do this, we used Facebook, which still needs to be integrated into the app to buy traffic. In addition, we often looked at the “lifetime value” section, which allows us to understand the dynamics of the payback of advertising.
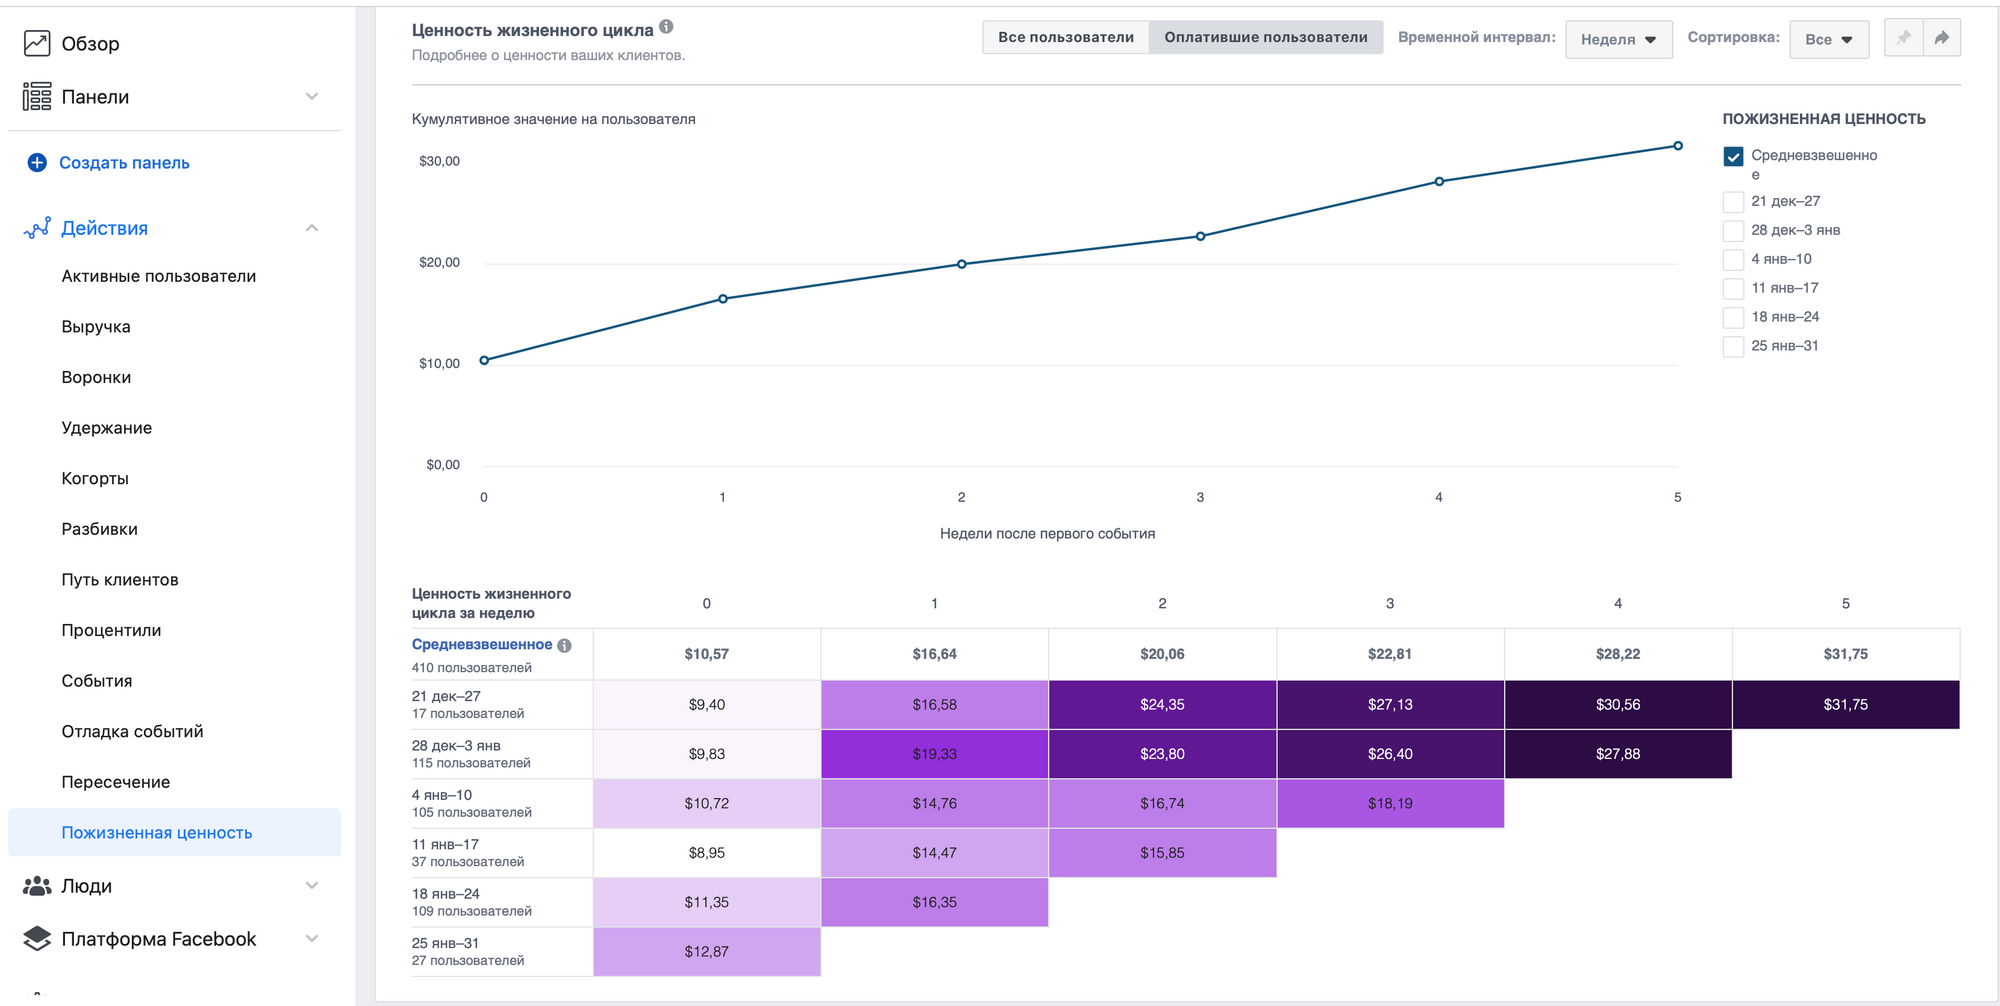
This is how the payback of advertising looks like
For a deeper analysis, we deployed the ClickHouse database, where we sent events related to gaming activity, economics and monetization. To work with ClickHouse, we used Redash, which allowed us to collect custom dashboards and write queries to the database via the web interface.
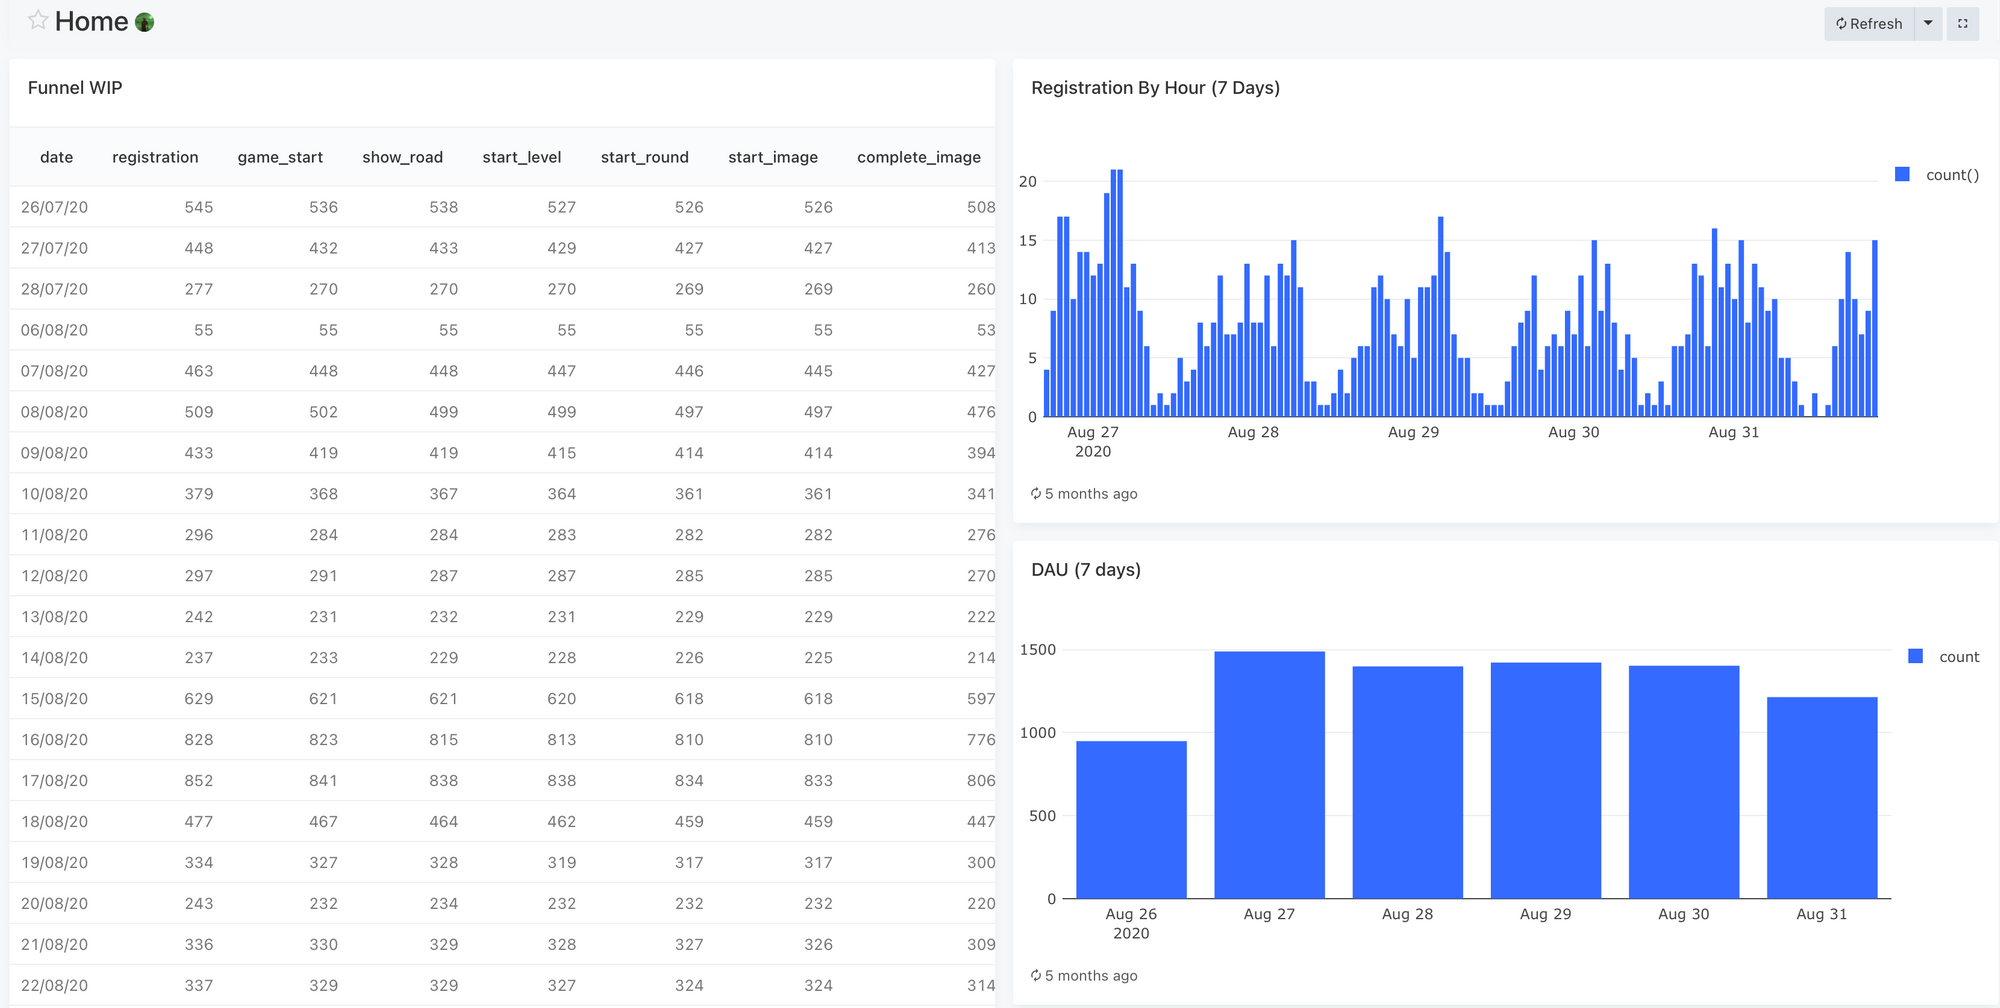
Example of a dashboard in Redash
Actually, in ClickHouse, we found a surplus in the economy — more game currency was introduced into the game than was withdrawn. We began to correct the balance by reducing the issuance of currency, but this did not lead to statistically significant changes. In parallel, we opened in the CIS and began to buy Russian traffic, but it was also far from paying off.
Then, in the course of the discussion, the idea came up to redo the tournaments. The game had the mechanics of weekly tournaments, players competed with each other to see who would score the most points. At the end of the week, the best received an award. There were real players in the standings. We decided to make completely fake tournaments personalized for the player. The tournament started on the day of its registration. During the first day, the player quickly got to the top, but by the next day, the bots were slightly overtaking him. Every next day, the player had to spend more and more effort to hold the top position. This change doubled the average check, but it was still far from payback.
At the beginning of August, it was decided to change the advertising purchase strategy. We were still buying 100 installations a day in Latin America, this was necessary in order to monitor retention rates for a more or less homogeneous audience. At the same time, there was an understanding that it was pointless to test monetization in Tier 3 countries. We decided to open the app in the UK and start buying traffic with optimization for purchases. The payback increased from 20% to 60%.
In August, our lead developer disappeared. I just stopped responding to messages in Slack, despite my online status. We were confused. Four days later, he appeared with an apology. He said that this happens to him consistently every year, he just burned out and he needs rest. Development stopped for two weeks.
In order not to waste time, I took up the solution of a long-standing problem. We discussed the complexity of the differences in the pictures a lot — to some they seemed too complicated, and someone found everything without difficulty. I wanted to get rid of subjectivity and get a mathematically sound assessment of complexity. It was clear that the size of the difference could be estimated by the number of pixels. But how to express by a number that blue on red is seen better than dark green on light green?
It turns out that there is a color space LAB, which takes into account the peculiarities of perception of the human eye. And by translating the pixel color coordinates from RGB to LAB, you can read how much two pixels differ from each other.
This allowed us to mathematically express the complexity of the differences, but, unfortunately, did not solve the problem completely. The prominence of the difference strongly depended on the picture itself. If the picture was colorful, with a lot of details, no matter how simple the difference was, it was still lost in the background.
I understood that the amount of visual information in the picture significantly affects the complexity. The amount of information is entropy, but Googling for the query “entropy of the image” did not give results. The solution turned out to be ridiculously simple — the amount of information in the picture is the file size of this very picture!
As soon as I began to take into account the size of the image in kilobytes in the complexity formula, the formula worked. This allowed us to build the difficulty curve in the game more correctly and increase the retention of the 28th day to 7%.
As of September, the paying user cost us $20, and brought us $14. We had to figure out how to get another $6. We got together and organized a three-day brainstorming session, following which we chose four main areas that could increase monetization:
- offers. Probably the most obvious way to increase revenue;
- additional monetization point. At that time, the only point of monetization was hints. We decided to add the opportunity to buy a magnifying glass, which allowed the player to enlarge the picture for a more convenient search for minor differences;
- events. According to statistics, it was clear that there is a significant part of the payers who stopped paying, but at the same time continued to play. We decided to add collectible events based on core gameplay to the game to create an incentive for further payments;
- bots. Our bots did not behave like real players. We decided to “humanize” them.
We spent the next two months implementing these ideas. None of them gave statistically significant changes either for the better or for the worse. By mid-December, we released a Christmas event and turned on traffic.
Despite the fact that this is the worst time to purchase, there was still hope to see some positive changes. On the third day, all campaigns were stopped. Looking at ROAS, we realized that advertising would barely pay off by 20%. It was decided to dissolve the team and curtail development.
I wrote above that there were two dark spots in the original application — the difficulty of finding differences and bots. Both mechanics were hidden, so they could not be accurately decomposed. And if, after experimenting with differences, we seemed to have figured out the complexity, then there was still a lot of incomprehensible things with bots. Except for one detail lying on the surface.
In our game, unlike the original, the player could not lose under any circumstances. When any bot had one difference left to win, it stopped and waited for the player to win. I have repeatedly suggested adding losses, but my colleagues had little faith that this could somehow affect the situation. At the end of December, when all other ideas were over, I insisted on appropriate changes in the bot config and the players sometimes started to lose.
After Christmas, the game was opened to the whole world on both platforms and traffic was turned on for the last time, while I went to prepare for the new year, update my resume and think about what I would like to do next.
Conclusion
“Hey guys. Happy New Year! Have you looked at the numbers?) It looks like we all behaved well last year and Santa Claus gave us a New Year’s miracle),” we received this message on the morning of January 3 from our traffic partner.
I started looking at statistics. On both platforms, our ROAS was significantly ahead of the target. It was obvious that by the end of the month all the traffic would pay off and come out as a plus. And, therefore, a new stage was coming in the life of the product, at which it was necessary to scale the game with the help of live ops and marketing, beat off development costs and start earning.
And my mission is over.